The Market Waits for Its Big Break (original) (raw)
The Market
I have said all week that unless/until we see those uptrend lines break this market is more apt to frustrate us than anything else. As you can imagine, there was no breakage today. The indicators haven’t mattered but there has been some movement in them so let’s review them.
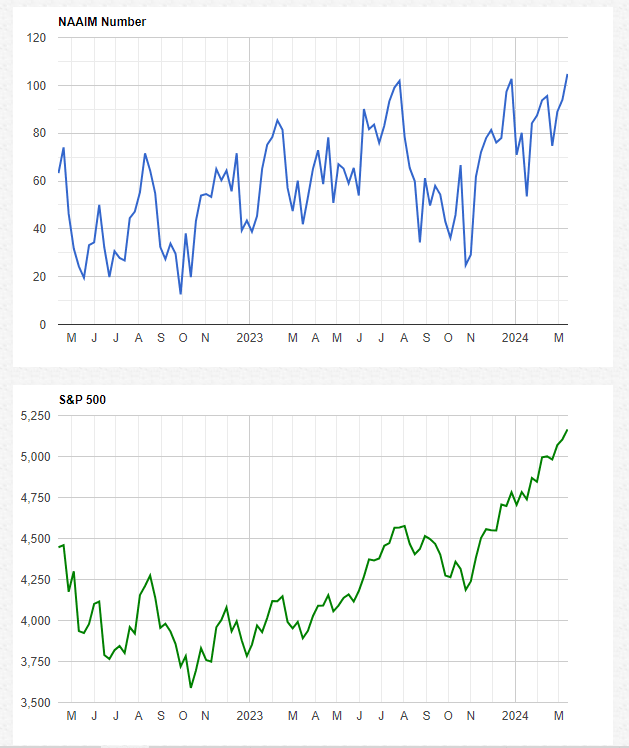
I am going to begin with sentiment because after Wednesday’s Investor’s Intelligence readings showed more than four times the number of bulls to bears today’s NAAIM Exposure number now shows they have lifted their exposure to 104.75. That is now higher than we saw at year-end, just before that swoon during the first week.
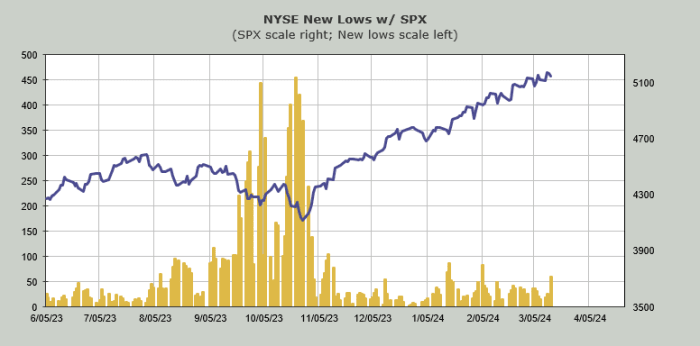
The number of stocks making new lows jumped up today. The NYSE saw 59, which might not seem like a lot but it was the most in six weeks.
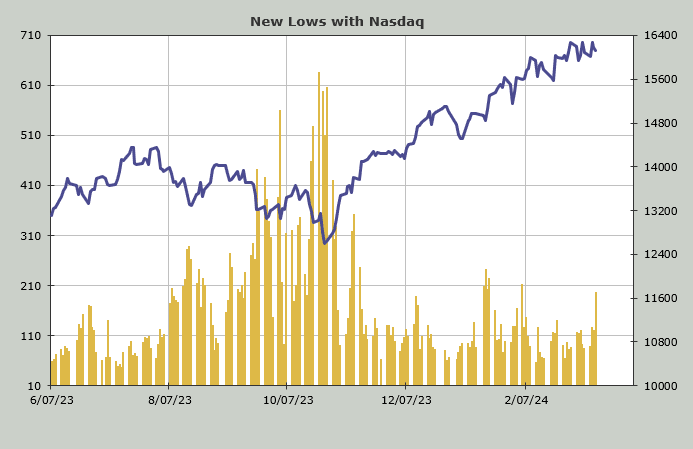
The Nasdaq, too, had the most in six weeks (196). That’s a big jump.
To show you how much selling has been going on under the hood over on the Nasdaq, the "what if" for the Nasdaq McClellan Summation Index (where I use volume instead of the a/d line) has surged to +4.2 billion shares. In other words, the Nasdaq now needs a net differential of +4.2 billion shares (up minus down volume) to get the Summation Index to turn back up.
Notice that typically we get these sorts of readings when the market has corrected already, not when it is still hovering at the highs.

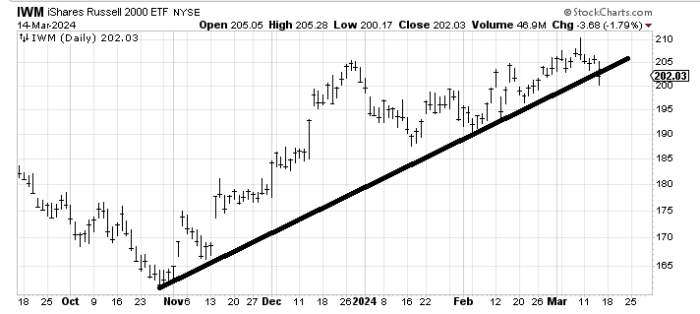
Now I noted that the uptrend lines are still intact but look at the iShares Russell 2000 ETF (IWM) , below. We have looked at this line before, back in early February, just before the small-caps rallied. They are hanging on the line by a thread. That chart just above (the "what if" for the Summation Index) would imply these stocks are getting oversold.
I would love to tell you how they have managed to get oversold in a few days while sentiment is at peak bullishness but I cannot. It’s part of the Either/Or Market.
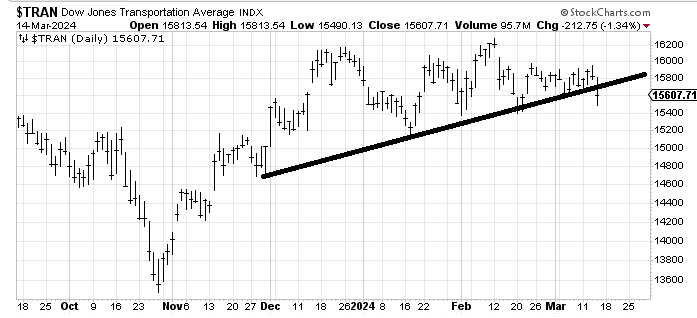
Another chart that is hanging by a thread is the Transports. It is my view that 15,400 is important as is 15,200, but 15,400 breaks the two prior lows and would make this uptrend line break for real.
But the S&P and the QQQs and the DJIA have not yet tagged their uptrend lines.
New Ideas
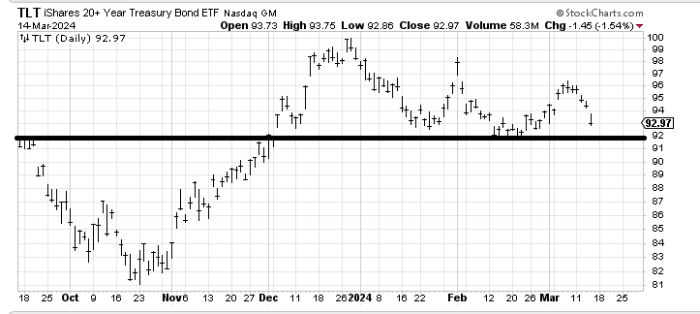
I have said I wanted to buy (TLT) back at 94anditblewthroughitonagap.Thereissupportat94 and it blew through it on a gap. There is support at 94anditblewthroughitonagap.Thereissupportat92 but for now I will wait to see if it can hold.
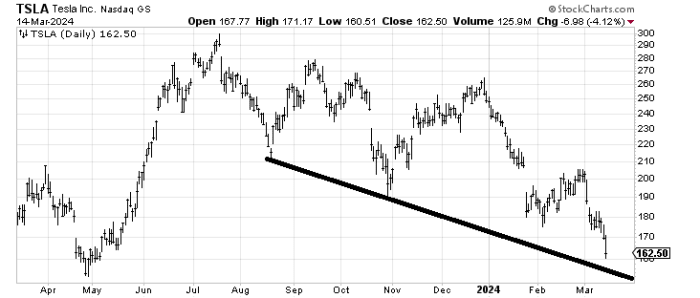
The other day I thought Tesla (TSLA) was oversold enough to bounce for a trade with a stop under $172. I was dead wrong as it has now collapsed. The only good news is that the stock has bounced off that line in the past and should be grossly oversold if it tags it. Also, now everyone is talking about it so it’s probably getting a little bit late for this leg lower.
Today’s Indicator
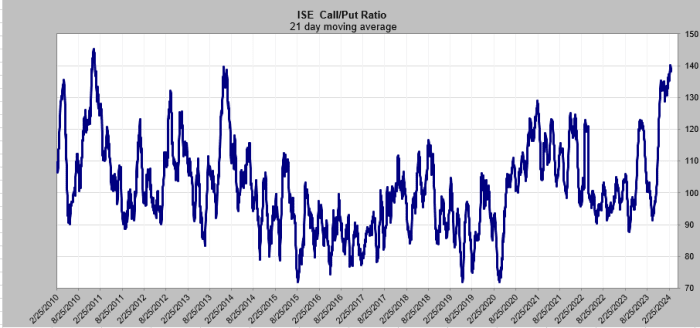
The 21-day moving average of the ISE Call/Put Ratio is at an extreme (it has turned lower, but it is hard to tell). Those two prior peaks you see on the left side of the chart, below, both occurred in January. The peak over 1.40 was in January 2011. The market did not care until March. The peak at 1.40 was in January 2015 and the market cared right away as there was a fast 5% pullback.
Q&A/Reader’s Feedback
Helene welcomes your questions about Top Stocks and her charting strategy and techniques. Please send an email directly to Helene with your questions. However, please remember that TheStreet.com Top Stocks is not intended to provide personalized investment advice. Email Helene here.
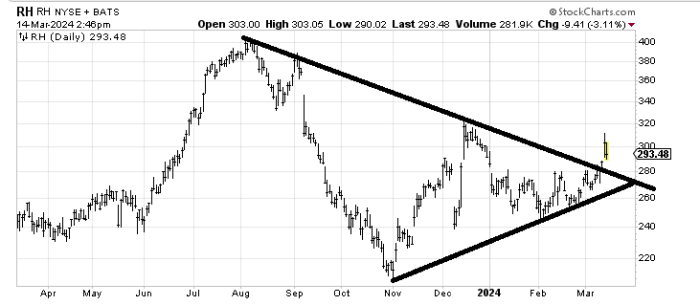
RH (RH) broke out and ran smack into resistance as well as a short-term measured target ($310). I would take another look at it on a pullback to the $270-280 area. If the market is oversold and sentiment is less bullish I’d probably like it down there.
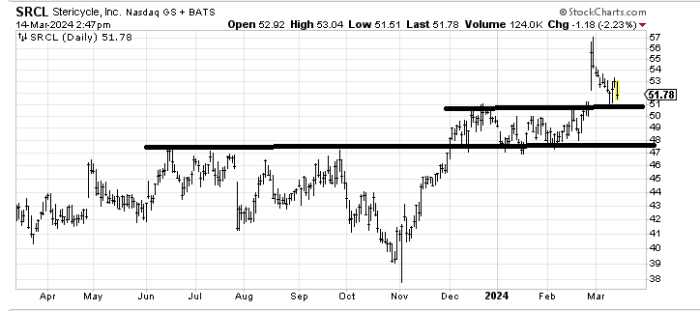
Stericycle (SRCL) has met its upside target when it got to 55−56inearlyMarch.Iamnotconvinceditwillhold55-56 in early March. I am not convinced it will hold 55−56inearlyMarch.Iamnotconvinceditwillhold51 on this pullback but to make the chart bullish again it would have to stay over this $50-51 area and then go sideways the way it did from December through February, building a base.
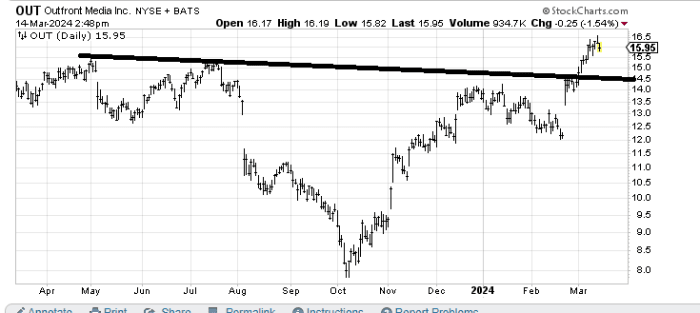
Outfront Media (OUT) measures longer term to 20−22butshorttermitisover−extendedandIwouldliketoseeapullbackintothat20-22 but short term it is over-extended and I would like to see a pullback into that 20−22butshorttermitisover−extendedandIwouldliketoseeapullbackintothat14-14.50 area.
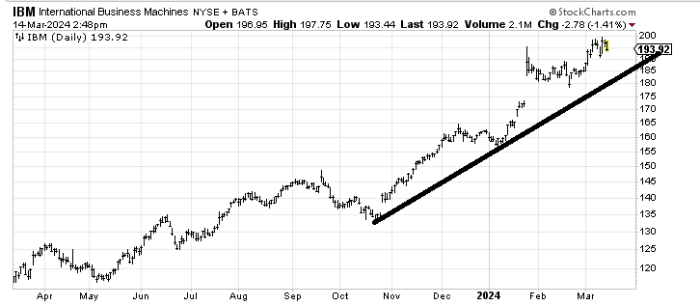
IBM (IBM) is a stock in an uptrend except there are signs of it losing upside momentum. Notice it is the same price it was on the gap up two months ago when the company reported earnings. It would be good if the stock could test that uptrend line to see if the buyers step up again down there.
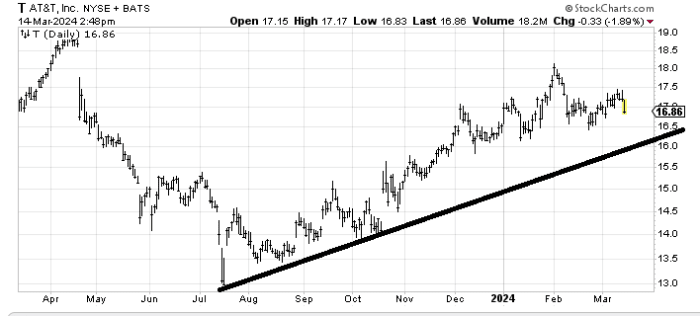
AT&T (T) is starting to look toppy and it is doing so before it filled that gap from last April (at 18.50),whichiswhereIthoughtitwouldgetto.Iwouldgetveryconcernedifthestockbreaksunder18.50), which is where I thought it would get to. I would get very concerned if the stock breaks under 18.50),whichiswhereIthoughtitwouldgetto.Iwouldgetveryconcernedifthestockbreaksunder16 as that is the January low and the uptrend line.
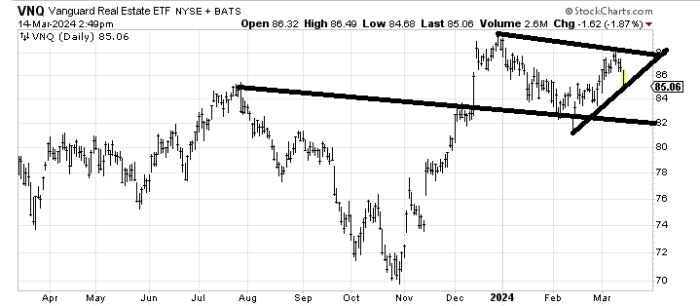
Vanguard Real Estate ETF (VNQ) , an ETF to be long real estate, has made a lower high and is now in danger of breaking that short-term uptrend line. If we can get the market back to an oversold condition and sentiment to back off and the chart is still over $82-ish I might be willing to take a stab at it on the long side.