Accenture Is Looking Vulnerable to a Correction: How to Play It Now (original) (raw)
Shares of the consulting company have turned lower from early September.
The global business consulting firm Accenture (ACN) rallied strongly from a low in March but now things may be shifting. Let's visit the charts and indicators.
In the daily bar chart of ACN, below, I can see that the shares have stalled in the $330 area the past four months. ACN has turned lower from early September and recently approached the 200-day moving average line. Trading volume has weakened since late May suggesting that investor interest has moved to some other area of the market.
The On-Balance-Volume (OBV) line has declined since mid-June and tells me that sellers of ACN have been more aggressive than buyers. The Moving Average Convergence Divergence (MACD) oscillator is now crossing below the zero line for an outright sell signal.
In this weekly Japanese candlestick chart of ACN, below, I can see that the stock is turning lower. ACN came close to a test and maybe a future break of the rising 40-week moving average line.
The weekly OBV line shows a declining trend from early 2022. The MACD oscillator is above the zero line but it has crossed to the downside for a take profits sell signal.
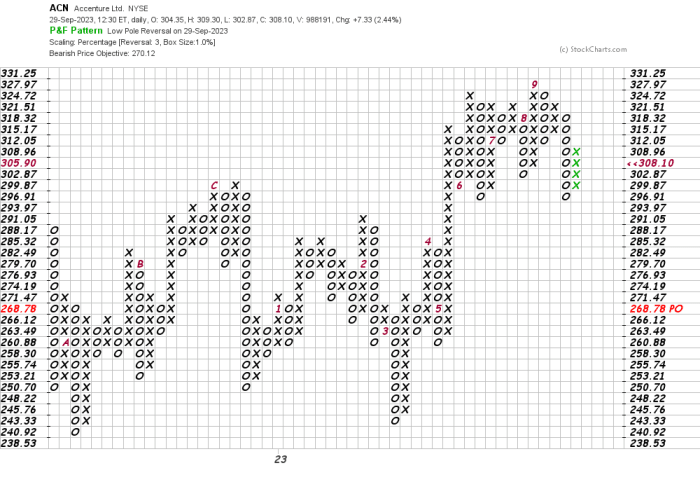
In this daily Point and Figure chart of ACN, below, I can see a downside price target in the $270 area.
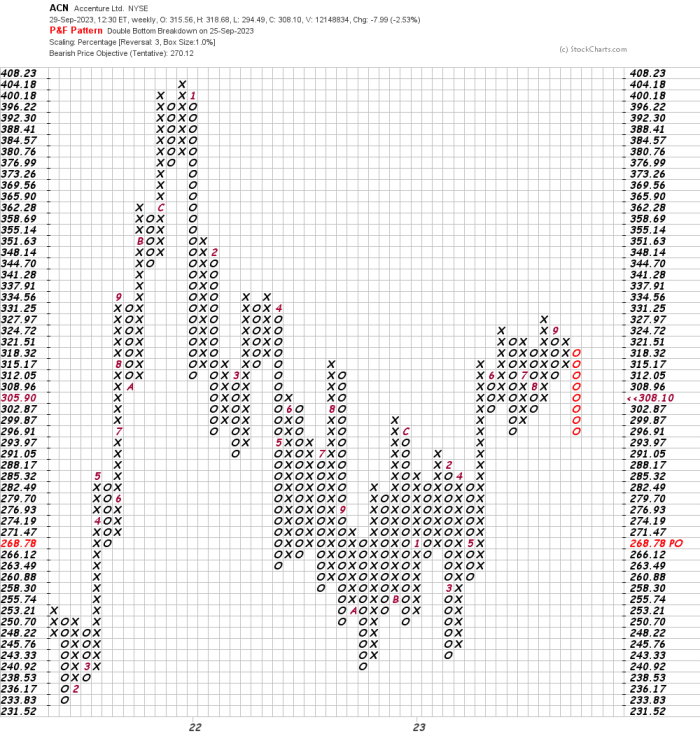
In this weekly Point and Figure chart of ACN, below, I can see the same downside price target as the daily chart shows -- $270.
Bottom-line strategy: The charts and indicators show me that the risk is shifting to the downside. Traders who are long ACN from a dip towards $300 should use available strength to exit those positions.
Employees of TheStreet are prohibited from trading individual securities.