Blue Lines and Price Action (original) (raw)
I often draw the most likely scenario directly onto a chart. My current scenario is playing out in real-time, with a key turning point this week. Let's also look at DELL, SPHR, EWZ, APP, BABA, TWLO, and JBHT.
The Market
Long-time readers will know that I often draw out (in blue) how I imagine a chart will play out. Call it an occupational hazard, where I just look at a chart, and my brain automatically sees how the chart will play out.
No, they don’t always work out as I imagine they will, but they often do. In most cases, when I map it out in blue for you, I will state that you should pay more attention to the pattern that I have drawn rather than the actual price.
With that in mind, I have said for a week now that I thought the short-term oversold condition would run out the clock this coming week. That remains the case. I expect the Overbought/Oversold Oscillator will get overbought on Tuesday. Remember, that doesn’t mean it has to be that exact day, but it’s that time frame, so let’s call it ‘early this week’. You can see how it has scooted itself well over the zero line. The math says even if the market is down on Monday, this will likely go higher, and then it turns south after that.

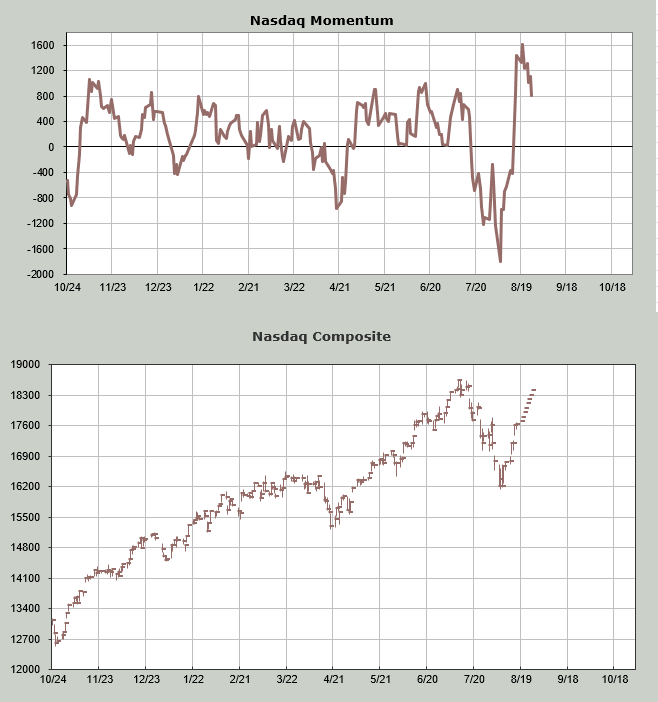
You may recall near the lows, we looked at the Nasdaq Momentum Indicator, where I kept plugging in lower lows for Nasdaq, and the indicator headed up anyway. That made it oversold. Now take a look at it. I have plugged in higher closes for Nasdaq over the next week or so and the indicator starts turning south on Tuesday. That makes it overbought.
Then there is the turn in sentiment. Yes, on the non-daily sentiment charts, folks seem pretty cautious (Investors Intelligence, AAII, NAAIM, the 10-day moving average of the put/call ratio, etc.) but Friday’s equity put/call ratio dipped right down to .51, the lowest since mid-July
With that in mind, take a look at the chart of the QQQs, the SOX and the S&P. It’s all the same chart, isn’t it? They are all sitting right at resistance. And they all have the potential of the same pattern to map out, don’t they?


It’s the cleanest on the chart of the QQQs where resistance is so obvious.
The end of the this week brings us the Fed’s Jackson Hole gathering so all eyes will be on Chair Powell. Perhaps he says something that gets all those ‘rate cuts coming’ folks to rethink something. Then again, that’s probably too obvious too!
New Ideas
One stock that is trying desperately to make a small bottom is JB Hunt (JBHT) . If it can get going, it ought to be able to fill that gap in the low 180s.

Today’s Indicator
We’re back to watching stocks that make new highs, and they are quite disappointing. I would call them negative at this point. I can rationalize it by noting that the rally was mostly led by the index movers, but it’s worth watching this.

Q&A/Reader’s Feedback
Twillio (TWLO) is trying to make a bottom. I think the stock can get to that 64 area in the near term but it has a lot of resistance up there. I view the chart favorably.

Could Alibaba (BABA) finally be ready to complete this bottom? Maybe but my guess is it struggles at resistance in the near term (86-90).

Applovin (APP) is not my kind of chart because it’s so close to resistance already, but if it can map out as I have drawn in blue, it could improve.

(EWZ) , an etf to be long Brazil had quite a week last week. It is closing in on quite a bit of resistance so I think it would be better if it mapped out something like I have drawn in.

If you want to know why I don’t trust Sphere (SPHR) to pull back and then keep rallying, just look at the chart. Nearly every single spike like that saw a pullback and another rally that died. Not another rally that kept on going. See mid-August last year, or late September, or early March this year. In other words, this chart probably pulls back to that 44-46 area but I’m not sure the subsequent rally does much more than take us right back to the low 50s. The pattern would have to change.

I was asked where Dell (DELL) can rally to and the first thing I would say is that when you get a 20% move in a week you take some profits. Away from that resistance in the 120-130 area seems strong.
