Estee Lauder Could Sure Use a Makeover (original) (raw)
The downtrend in the stock seems to be entrenched.
Estee Lauder (EL) is set to release its Q2 results on Monday, Aug 19 before the opening bell. Traders and investors are not waiting for the latest quarterly numbers and are pressuring the stock lower.
Let's check out the charts and indicators.
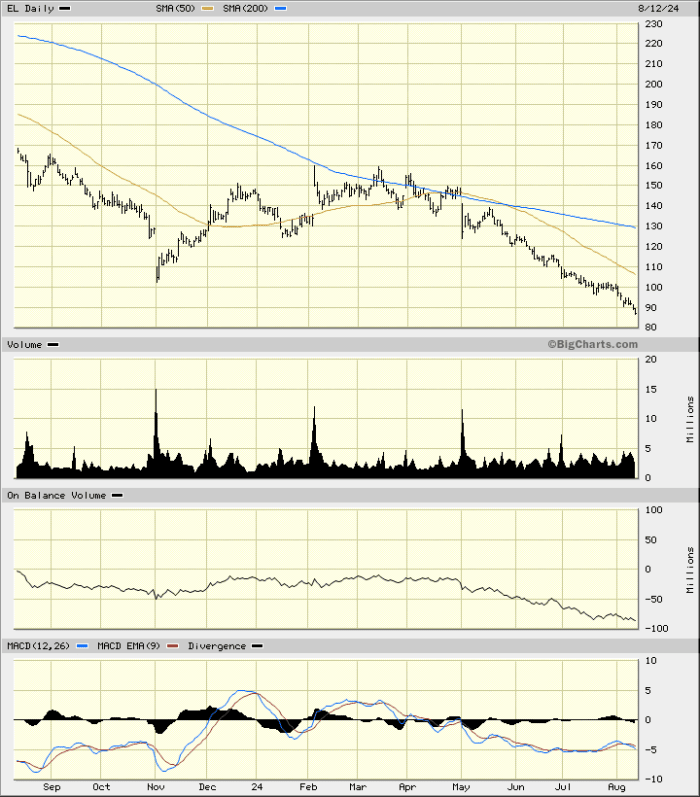
In the daily bar chart of EL, below, I can see that the shares have trended lower the past 12 months. Prices trade below the declining 50-day moving average line and below the declining 200-day moving average line. Math tells us that EL is in a downtrend.
The On-Balance-Volume (OBV) line has been weak since early March and tells me that sellers of EL have been more aggressive than buyers. The Moving Average Convergence Divergence (MACD) oscillator has been below the zero line since early April.
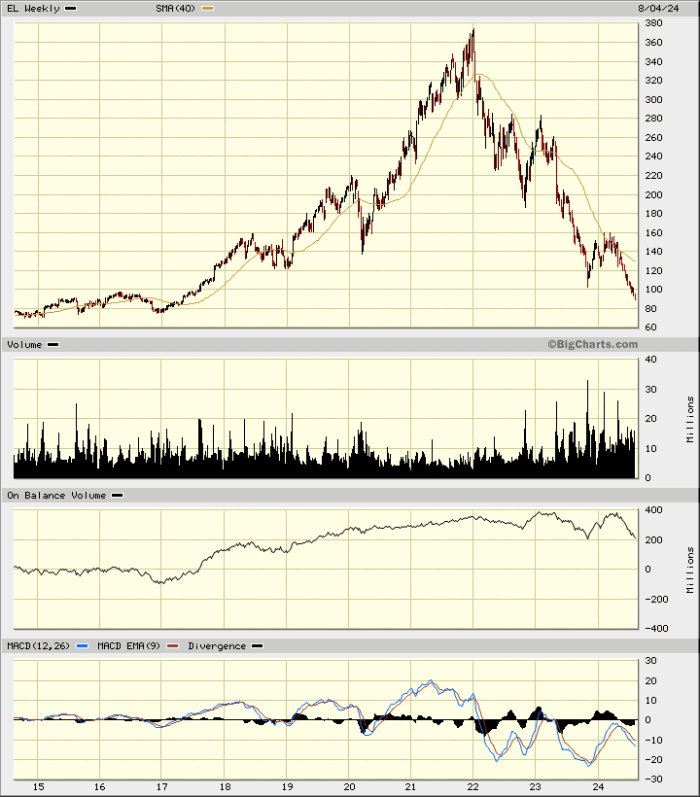
In the weekly Japanese candlestick chart of EL, below, I went back 10 years to help decide where EL could be going. Prices are in their third year of weakness. A top pattern in 2022 and 2023 suggests even further weakness is possible.
The OBV line started to weaken in early 2022. The MACD oscillator has spent a lot of time below the zero line since early 2022.
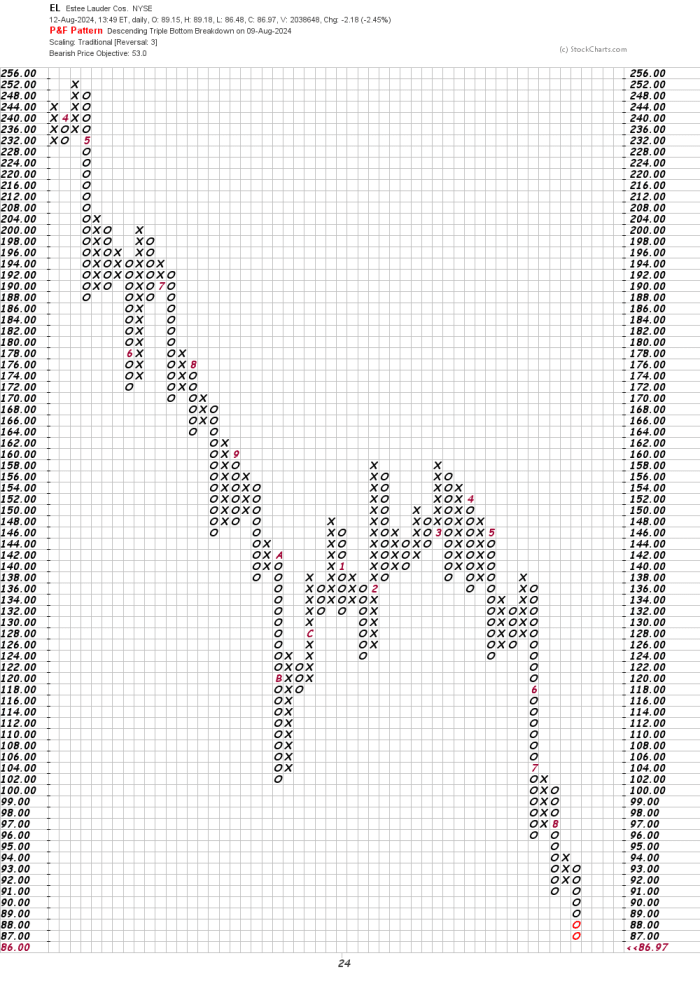
In this daily Point and Figure chart of EL, below, I can see a potential downside price target in the $53 area.
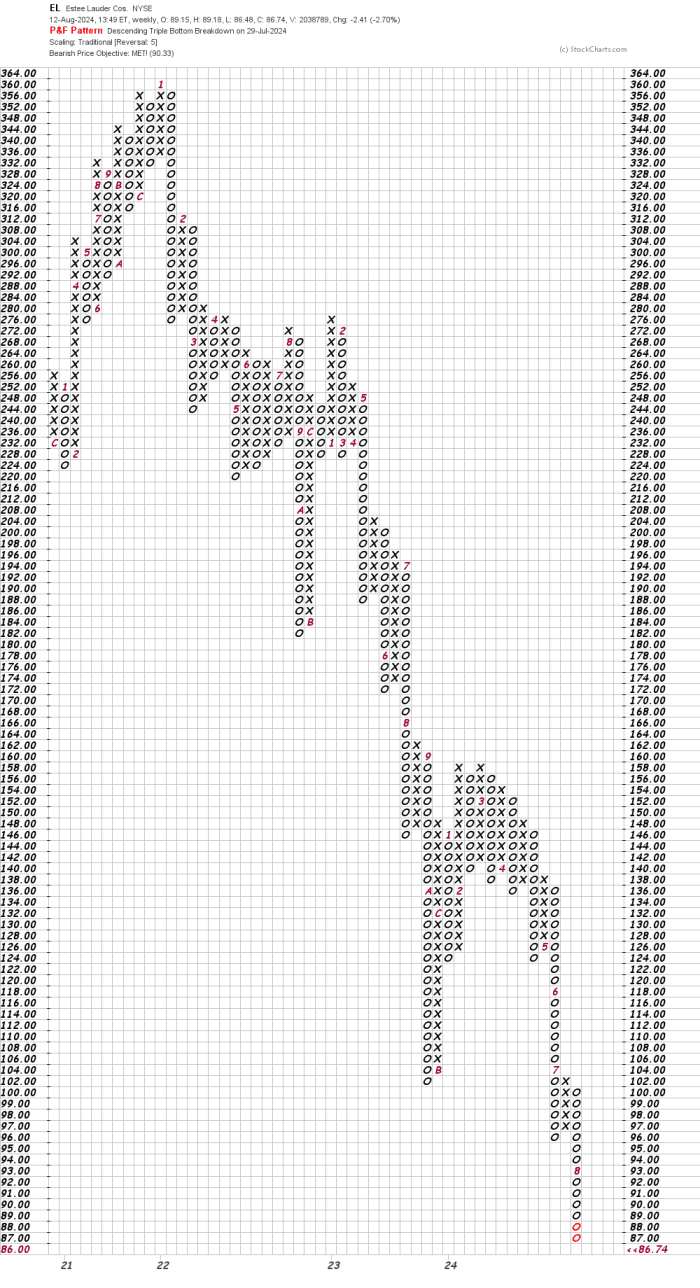
In this second Point and Figure chart of EL, below, I used weekly price data with a five-box reversal filter. Here the projected target is in the $90 area, which has already been reached.
Bottom-line strategy: The downtrend in EL seems to be entrenched as I see no clues suggesting that a bottom may be developing anything soon. Avoid the long side of EL.
Employees of TheStreet are prohibited from trading individual securities.


