For Estee Lauder, There's No Bottom in Sight (original) (raw)
Shares of the beauty company are certainly showing their age.
The share price of beauty products empire Estee Lauder (EL) has started to show its age. The shares have declined the past three years so the wrinkle cream does not appear to be working.
Let's check out the charts and indicators.
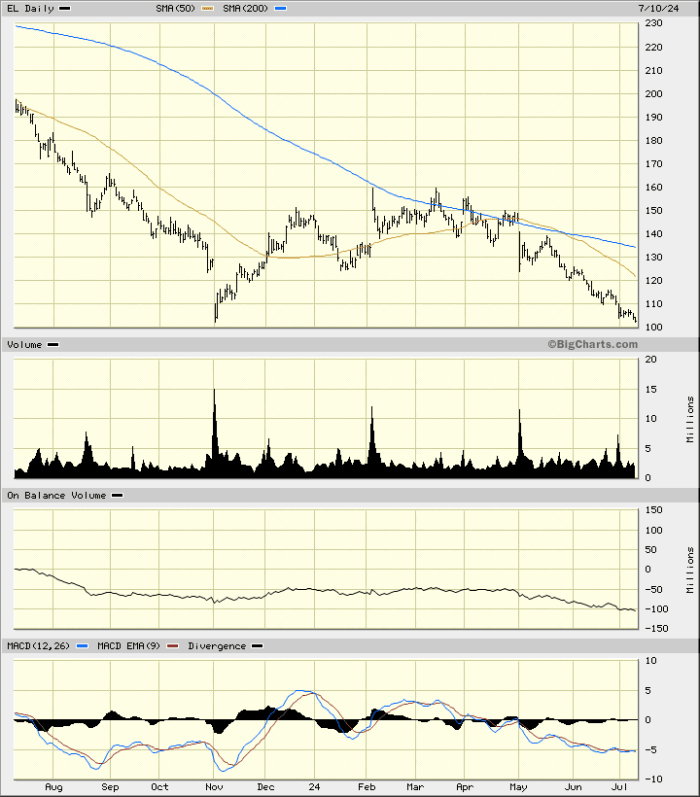
In the daily bar chart of EL, below, I can see a decline over the past year. The shares trade below the declining 50-day moving average line and below the declining 200-day line.
The On-Balance-Volume (OBV) line shows us a gentle decline the past year. The Moving Average Convergence Divergence (MACD) oscillator is in a bearish alignment below the zero line and has spent much of the last twelve months below the zero line.
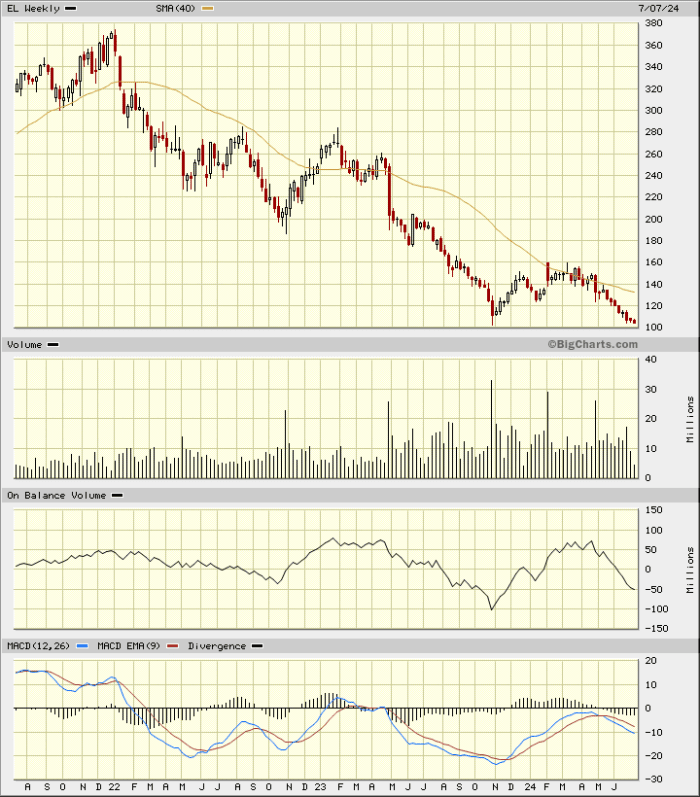
In the weekly Japanese candlestick chart of EL, below, I can see that the shares have declined the past three years. Prices trade below the negatively sloped 40-week moving average line.
The trading volume has increased in the direction of the trend and that is a negative. The OBV line has not made a new low with the price action but is still overall bearish. The MACD oscillator is in a bearish alignment below the zero line.
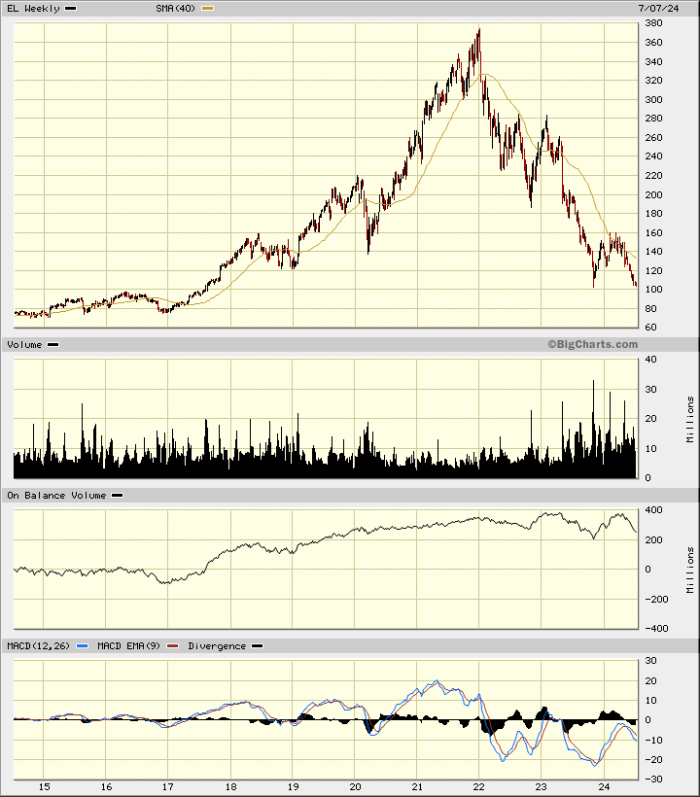
In this second weekly candlestick chart of EL, below, I went back 10 years. Here we can see that prices have been weak since making a peak in late 2021. The next price target on this chart is $80.
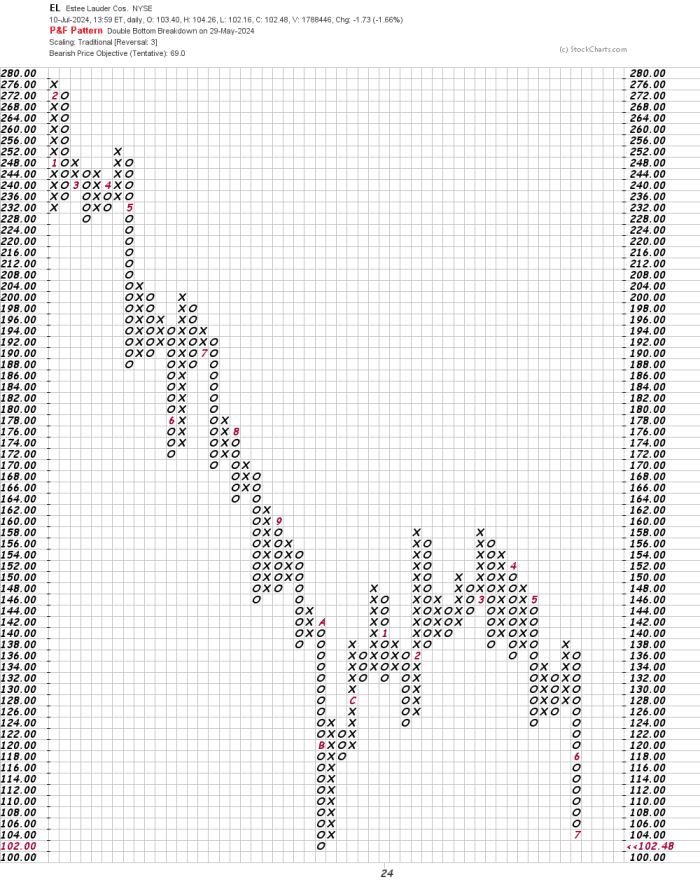
In this daily Point and Figure chart of EL, below, I can see a potential downside price target in the $69 area.
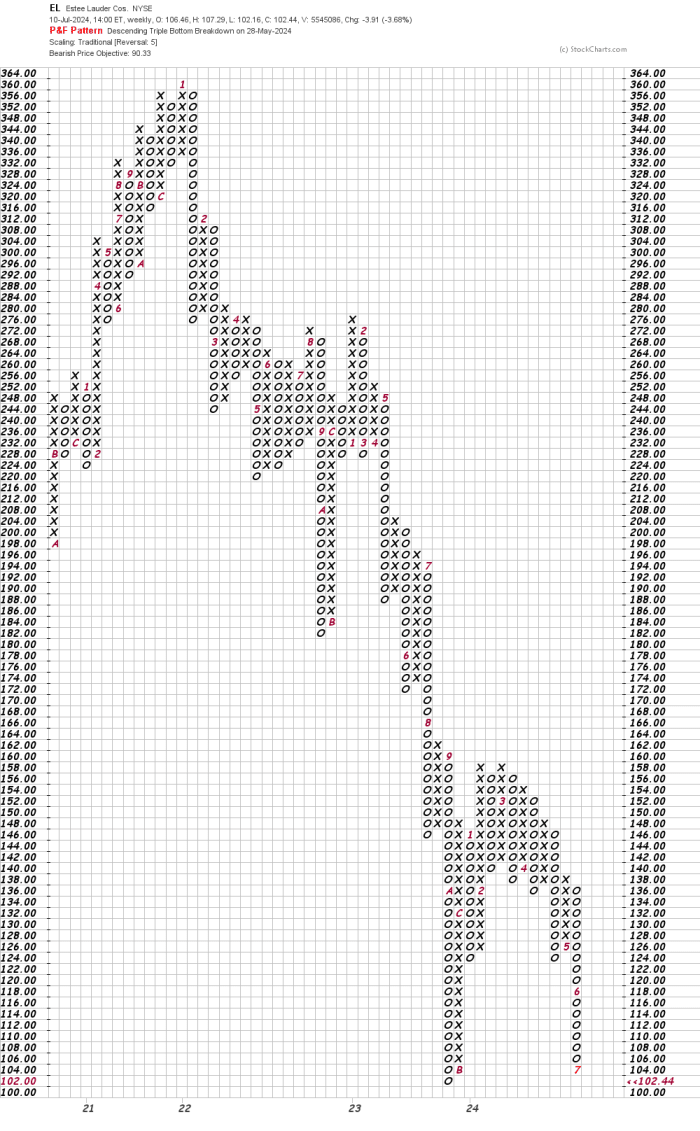
In this weekly Point and Figure chart of EL, below, I used a five-box reversal filter to get a price target in the $90 area.
Bottom-line strategy: EL shares are pointed lower and I see no signs of a bottom. Avoid the long side of EL.
Employees of TheStreet are prohibited from trading individual securities.
