Heavy Markets, Economic Fairyland, Recession Talk, SPY Chart, Doug Kass Outlook (original) (raw)
Wednesday beckons. Good Morning one and all. Equity markets felt so heavy on Tuesday because they were and are. Haven't we been ringing a warning bell on the economy for some time now? Of course we have. The economy has been heavier than it appears at the headline level for a long while.
While the "smarty-pants" crew touted a Q3 GDP print in the US that showed a seasonally (heavily) adjusted, annualized, quarter over quarter rate of 4.9% growth, the very same report also showed a salted and peppered, and then annualized quarter over quarter print of just 1.5% for Q3 GDI.
For those unaware, GDP and GDI measure the same activity and in theory should equal one another. When there is a disparity due to methodology such as there was in the third quarter, economists usually just average the two. So, while headline US economic growth for that third quarter either ran at a 4.9% pace or at 1.5%, and while most economists would divide the sum of the two and come up with growth of 3.4%. What did the financial media report economic growth as? That's right... 4.9%.
Why? Because maybe among the three possible numbers, it is by far the most optimistic? I can't speak for the media, but I find it alarming that the most optimistic numbers are always reported as fact. They think we're stupid.
Just take a look at the Non-Farm Payrolls every month as reported by the establishment survey, which is one of the two surveys released simultaneously by the Bureau of Labor Statistics every first Friday of the month. On an almost every month basis, the Non-Farm Payrolls number is decisively more optimistic than either the BLS household survey's number for growth in employed persons or the ADP print for growth in private payrolls. Then the BLS revises (almost always lower) that NFP print over the two following months. Yet, decisions are made (by leaders, legislators, policy makers, investors, and households) based on that first number and the assumption that US labor markets are considerably stronger than they really are.
We'll get a look at some significantly impactful domestic macroeconomic data this morning when the Census Bureau publishes December Retail Sales at 08:30 and the Federal Reserve Bank posts data for Industrial Production at 09:15. After you wash down all of that data, the Fed will also release its latest version of the Beige Book, which is an anecdotal (not data-based) collection of economic information across the twelve regional Fed districts. This book is released eight times a year, two weeks ahead of every upcoming FOMC policy decision. The last few of these "beige book" releases have become decisively more and more negative.
Should retail sales come in hotter than expected, you will hear on and on, just how strong the US consumer is, even if that consumer supported those purchases through the ever expanding use of revolving credit as a medium of transaction. You see in economic fairyland, increased retail sales always reflects consumer strength and a willingness to borrow at absurd rates in order to support those sales is always a reflection of confidence, and never a reflection of households desperately trying to maintain their familial standard of living.
Empire State of Misery
Jaw-dropping. That's the only way to describe the results of the NY Fed's Empire State Manufacturing Survey for January. Yes, this report only covers the manufacturing base within the New York district. Yes, the Philadelphia Fed will release their manufacturing survey for January this Thursday and that one is the most closely followed regional manufacturing survey by US economists. Still, New York matters and New York made like a pea rolling off of a table in January.
At the headline, the Empire State posted a -43.7 print. To put this in perspective, anything below zero is considered contractionary. A -20 print is considered deeply contractionary and a -30 print is close to unheard of. Wall Street was looking for -5. New Orders, which is the most important component of any manufacturing survey, fell from -11.3 in December to an astonishing -49.4. Shipments, Unfilled Orders, Inventories, Number of Employees and Average Employee Workweeks all printed in the hole as well. You know what did print in expansion? Prices Paid and Prices Received. Again, as both had also printed in a state of expansion in December. Yes, that's inflationary and runs counter to the narrative that you've been repeatedly beaten over the head with for months.
Just as a heads up... The Empire State Manufacturing Survey has only existed since 2001 and January 2024 is now the weakest month in the history of this report excluding the pandemic lockdown period in 2020.
Last Week...
"The curve de-inverting is highly suggestive of a recession. And I think the dollar is going to have big problems in the next recession, as a consequence of the policies that we run to try to deal with what could be a very painful recession."
- DoubleLine Capital CEO Jeffrey Gundlach
Davos !!
The carnival of the inane and the ridiculous (yawn) continues on Wednesday morning as those who would lecture others on climate change skip in and out of the Swiss ski resort town on their private planes, while congratulating one another on their unique specialness.
Ever Try...
To bench press more than you can? How about squatting more than you can? Now, that's an awful feeling. Even if you were not stupid enough to make the attempt without spotters. Equity markets felt kinda like that on Tuesday and have sort of felt like that since Santa failed to make his appointed rounds a few weeks ago.
On Tuesday after the absolutely disastrous Empire State Manufacturing release for January, which first level thinkers might have expected to put upward pressure on US Treasury securities did not. Instead, in response to several ECB (European Central Bank) officials had put the whammy on European equities as they seemed difficult to read. Then, Fed Gov. Christopher Waller spoke publicly, and while he was dovish in my opinion, he was clearly not dovish enough for the junkies up and down Wall Street.
Waller said... "As long as inflation doesn't rebound and stays elevated, I believe the FOMC will be able to lower the target range for the federal funds rate this year." This year? The junkies have their hearts (and wallets) set on a rate cut as soon as March. Then, Waller absolutely floored that needy crew... "With economic activity and labor markets in good shape and inflation coming down gradually to 2%, I see no reason to move as quickly or cut as rapidly as in the past."
Oh, that one was good for a real belly laugh. No reason to move quickly? Honestly, after that December CPI print showed some mild re-acceleration in consumer prices, I would agree with a cautious approach. I mean, equity prices do have to consolidate in order to maintain any semblance of health. That is understood, right?
I mean, we all understand that a global recession, or at least something close to one will be tough on US large-cap multinational corporations. Right? We do understand that rising US dollar valuations relative to other reserve currencies is a negative force on everything priced in US dollars. Right? Yes, that would include both equities and commodities. At least a stronger dollar is disinflationary. Huzzah !!
Something has to offset the expectation for rising prices on goods (that have been ice cold for a long while) that a rerouting of merchant vessels around the Red Sea will ignite. Easy to forget about violence at a key global trade route choke-point if one lives in a silo. Don't live in a silo.
Cash on The Sidelines Will Force New Highs?
I absolutely love the following quotes that I lifted from the Dougie Kass 2024 piece on Tuesday. Dougie wrote... "Despite the enormity of the drop in yields, the equity risk premium is still paper thin - and historically this is a reasonable predictor of weak markets." Doug then added... "To me, Treasury yields are still high relative to the lowly S&P dividend yield. Moreover the S&P dividend yield compares unfavorably to the one-year Treasury Bill yield 4.80% and a three-month Treasury note (bill) yielding 5.40% - the gap between the S&P dividend yield and Treasuries is at a multi decade wide.
Doug was not done. He closes the cash on the sidelines argument with this.. "In other words, a reasonable risk free, nonvolatile, and equity-like return can be achieved in short term Treasuries today. If one goes out further to somewhat risky credit, fixed income returns are in excess of historic equity returns."
Stocks
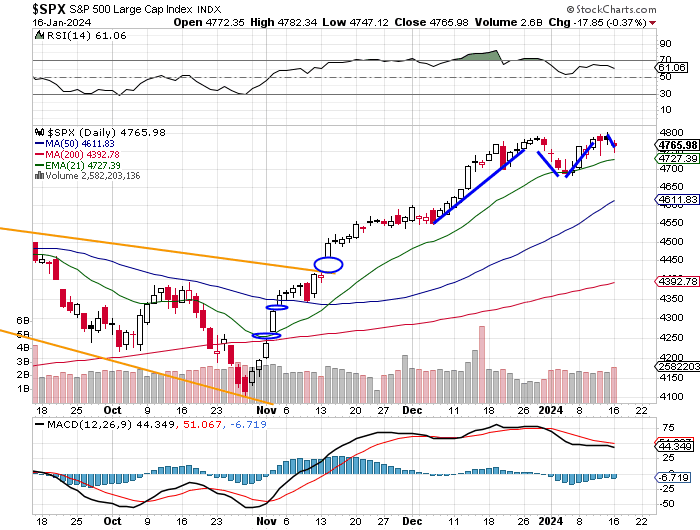
Equity markets were broadly lower on Tuesday as trading volumes exploded to the upside. Is that meaningful? Usually. The S&P 500 gave up 0.37% on Tuesday as the Nasdaq Composite surrendered just 0.19%. The Nasdaq 100 essentially closed unchanged. That speaks to how narrow any positive performance was on Tuesday.
Expanding one's view, the Dow Transports backed up 0.83%, the small-cap Russell 2000 lost 1.21% and the KBW Bank Index took a hit of 1.32%. The Philadelphia Semiconductor Index was the standout on Tuesday, gaining 1.32%.
Double Top with unfilled gaps well below?
Ditto...
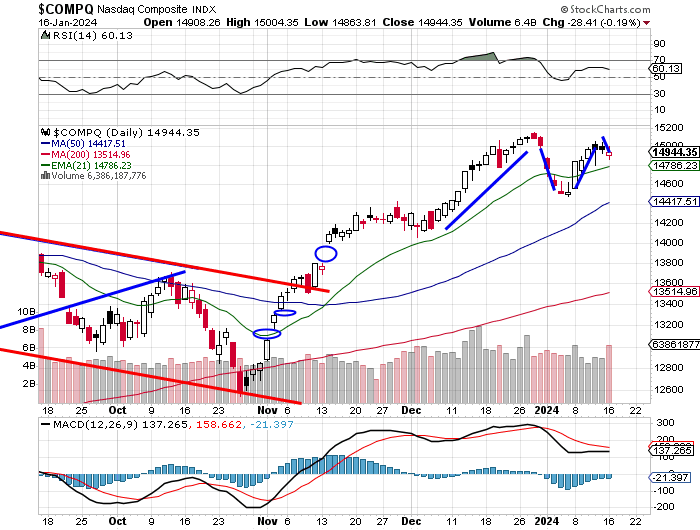
See that volume pop on Tuesday?
Ten of the eleven S&P sector SPDRs closed in the red on Tuesday, led lower by Energy (XLE) at -2.38%. The Materials (XLB) , Utilitie (XLU) , and Industrials (XLI) all surrendered more than 1% for the session. Only Technology (XLK) closed in the green at +0.25% and that was with the semis up huge as mentioned above.
Advanced Micro Devices (AMD) was the star of the day, up a stunning 8.31%, as Nvidia (NVDA) also ran 3.06% and Micron (MU) popped for 2.69%. This strength was provoked by four-star rated (by TipRanks) analyst Tom O'Malley of Barclays who cited demand for generative AI infrastructure and specifically, strength in the AMD MI300 AI-capable GPU that is meant to be competitive with Nvidia's top offerings in the space. O'Malley took his target price for AMD up to 200from200 from 200from120 while maintaining an "overweight" rating.
Susquehanna's five-star rated analyst Christopher Rolland and KeyBanc's John Vinh also reiterated their buy-equivalent ratings, while taking their targets for AMD from 130to130 to 130to170 and from 170to170 to 170to195, respectively.
Breadth
Losers beat winners by a rough 7 to 2 margin at the NYSE and by about 5 to 2 at the Nasdaq. Advancing volume took just a 13.6% share of composite NYSE-listed trade and a 47.3% share (thanks to the semis) of composite Nasdaq-listed action. Aggregate trade increased by 22.2% on a day over day basis for NYSE names and by 28.8% on a day over day basis for Nasdaq names.
Trading volume across both the S&P 500 and the Nasdaq Composite exceeded their respective 50 day trading volume SMAs. Yes, that means that portfolio managers are getting a little rattled up here.
You're Going To Love This
Below, on Tuesday's intraday chart of the SPDR S&P 500 ETF (SPY) , readers will see how the fund (and the underlying index) rallied sharply into the close over the final moments of trade to close down just 0.37%. The following quote sums this action up perfectly in my opinion...
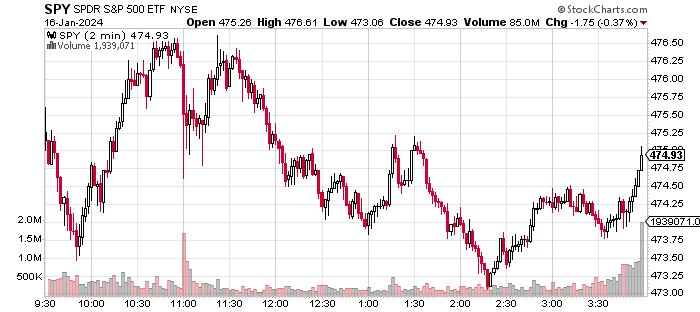
You follow Keith McCullough, CEO and cofounder of Hedgeye Risk Management on Twitter of X? If not, maybe you should. I find McCullough both informative and entertaining. On Tuesday evening, Keith tweeted (posted): "The level of short-term US Options manipulation is epic at this point. See that little markup in the final minutes into the close? The #1 Most Active 0DTE contract was the $SPY 475 Calls with > 534,000 contracts (that's not Jack and Janet Jr gambling the PA at home). FYI."
Economics (All Times Eastern)
07:00 - MBA 30 Year Mortgage Rate (Weekly): Last 6.81%.
07:00 - MBA Mortgage Applications (Weekly): Last 9.9% w/w.
08:30 - Retail Sales (Dec): Expecting 0.4% m/m, Last 0.3% m/m.
08:30 - Core Retail Sales (Dec): Expecting 0.2% m/m, Last 0.2% m/m.
08:30 - Import Prices (Dec): Expecting -0.6% m/m, Last -0.4% m/m.
08:30 - Export Prices (Dec): Expecting -0.6% m/m, Last -0.9% m/m.
09:15 - Industrial Production (Dec): Expecting -0.1% m/m, Last 0.2% m/m.
09:15 - Capacity Utilization (Dec): Expecting 78.7%, Last 78.8%.
08:55 - Redbook (Weekly): Last 5.9% y/y.
10:00 - Business Inventories (Nov): Expecting -0.1% m/m, Last -0.1% m/m.
10:30 - Natural Gas Inventories (Weekly): Last -86B cf.
13:00 - Twenty Year Bond Auction: $13B.
16:30 - API Oil Inventories (Weekly): Last -5.215M.
The Fed (All Times Eastern)
09:00 - Speaker: Reserve Board Gov. Michael Barr.
14:00 - Beige Book
15:00 - Speaker: New York Fed Pres. John Williams.
Today's Earnings Highlights (Consensus EPS Expectations)
Before the Open: (SCHW) (0.64), (USB) (0.90)
After the Close: (AA) (-0.85), (DFS) (2.51)
(XLE is a holding in the Action Alerts PLUS member club. Want to be alerted before AAP buys or sells XLE? Learn more now.)
At the time of publication, Stephen Guilfoyle was long AMD and NVDA equity.