This Tech Stock Has a Base Pattern That Chartists Dream About (original) (raw)
Technically oriented traders will like what they see here.
Infosys Ltd. (INFY) is a global leader in next-generation digital services and consulting. What they do is is probably above my pay grade but the charts have made a strong base pattern that could support further gains.
Let's check them out.
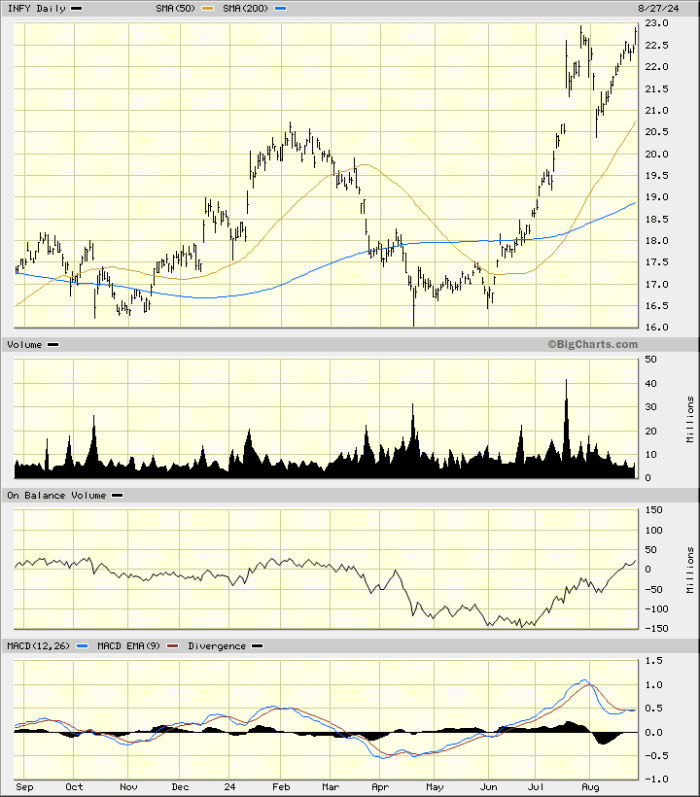
In the daily bar chart of INFY, below, I can see that the shares have rallied strongly from lows in April/May. INFY trades above the rising 50-day moving average line and above the rising 200-day moving average line. Prices corrected to the downside earlier this month but quickly rebounded to climb back to the highs.
The trading volume has been more active since April telling me that more investors have become interested in INFY. The On-Balance-Volume (OBV) line has made a strong move up from June as traders have been more aggressive buyers than sellers. A rising OBV is bullish. The trend-following Moving Average Convergence Divergence (MACD) oscillator is in a bullish alignment above the zero line.
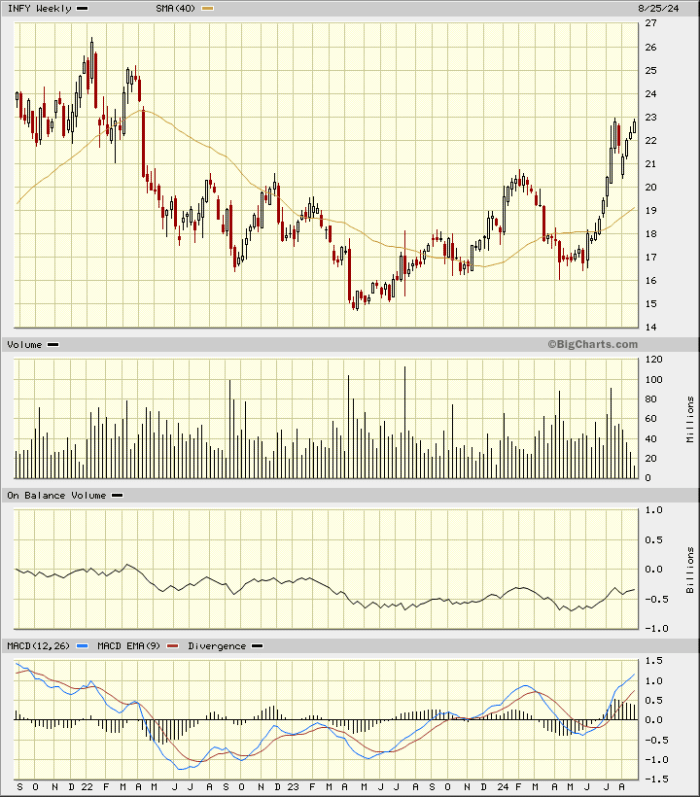
In the weekly Japanese candlestick chart of INFY, below, I see a great-looking base pattern. Did I say great looking? Notice the weekly volume histogram, which shows declining on the left side of the base, heavier at the nadir and then increasing since November. As the pattern matured traders became more confident in the stock and their trading volume increased.
The OBV line bottomed last June is slowly increasing. The MACD oscillator is in a bullish alignment above the zero line and prices trade above the rising 40-week moving average line.
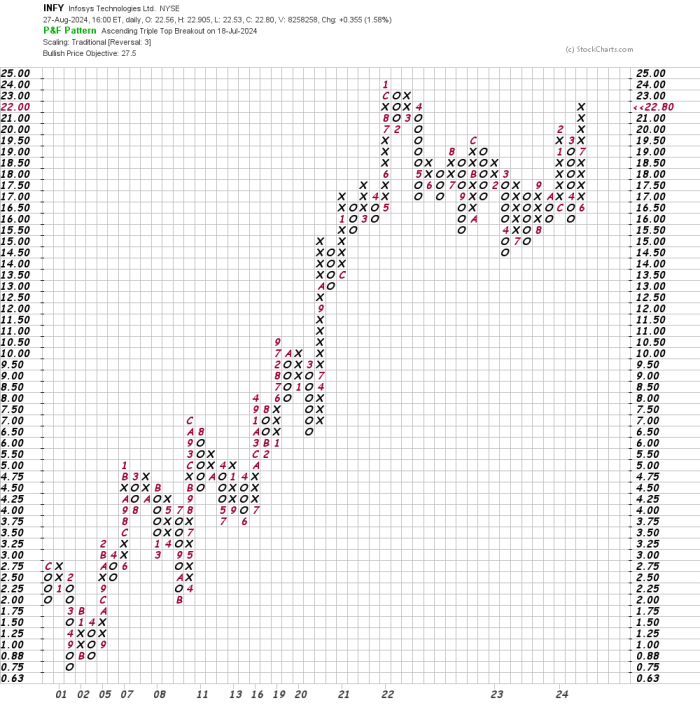
In this daily Point and Figure chart of INFY, below, I can see an upside price target in the $28 area. It's a start.
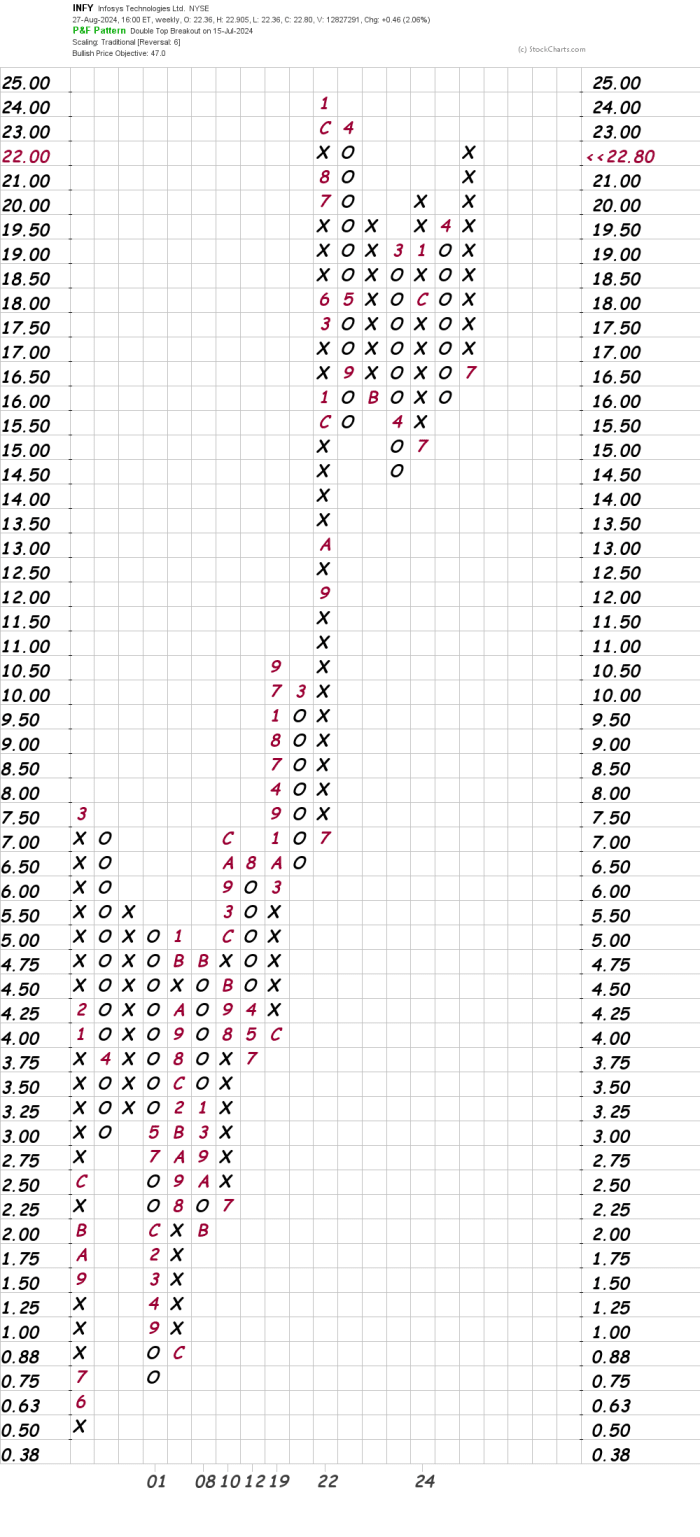
In this second Point and Figure chart of INFY, below, I used weekly price data with a five box reversal filter. Here the software is suggesting a price target in the $47 area.
Bottom-line strategy: Technically oriented traders will like what they see on the charts above. Feel free to check out the fundamentals. Traders could go long INFY on a dip to around 22riskingjustbelow22 risking just below 22riskingjustbelow20 for now. My potential price targets are 28andthen28 and then 28andthen47.
Employees of TheStreet are prohibited from trading individual securities.


