On Friday, Stocks Have to Work to Be Green (original) (raw)
The last 6 Friday’s have been up days. For that to continue, we’ll need a positive Employment report. Meanwhile NVDA has stolen every other stock’s volume. Plus, analysis of NVDA, PYPL, AAP, NSC, OXY, and CNDT.
The Market
Everyone is on pins and needles waiting for the Employment Number on Friday. I have no view on whether it will be strong or not but bonds have had one heckuva rally this week already so my view is the number would have to be super duper weak for bonds to go much lower on this number.
And then I ask if the number is super duper weak, what happens to stocks?
What if the number is Goldilocks-esque? Well then we might get the non-Nvidia names rallying, at least for a day.
We all know the market has become Nvidia undefined vs. the rest so I find it fascinating that today Nvidia backed off but all the rest did not rally. That’s a modest change.
I saw where Nvidia’s relative volume is now larger than the next 20 stocks. That explains the Nvidia or everything else market, doesn’t it? Especially when we consider how overall volume in the market has really tailed off in the last week.
Even today with (AMC) and (GME) as the most active stocks volume was back to April levels. So when we ex out AMC, GME and NVDA it does not leave a whole lot of volume to be traded elsewhere, does it?
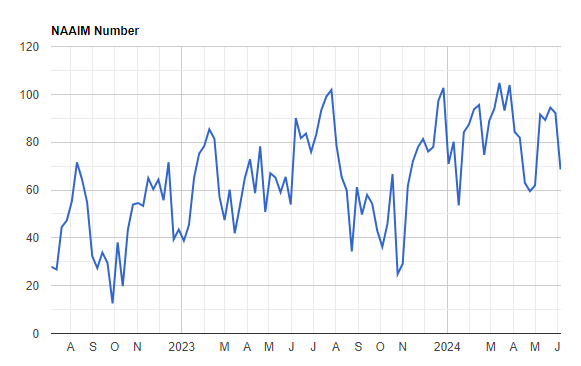
Indicator-wise not much changed today. There was however a significant change in the NAAIM Exposure which is unconfirmed by any of the other sentiment indicators but it has been a good indicator so I share that exposure to the market is now at 66. As a reminder, it got to 60 at the April low.
I will leave you with one more thing I’m watching: the last six Fridays the S&P has been green. That means we haven’t had a down day on Friday since April 19th, which you might recall was the low off that spring correction. Can the streak continue?
New Ideas
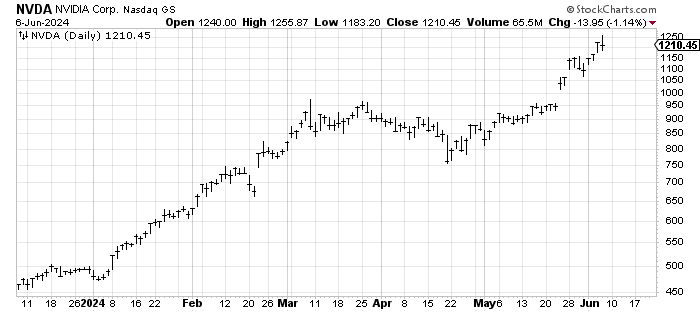
I have been asked by several readers about NVDA. Is it vulnerable to a correction? Of course it is. What would turn the chart negative? A gap down under 1150 that cannot be recaptured would leave a small island overhead. But in the big picture a series of lower highs and lower lows is what would get the chart toppy.
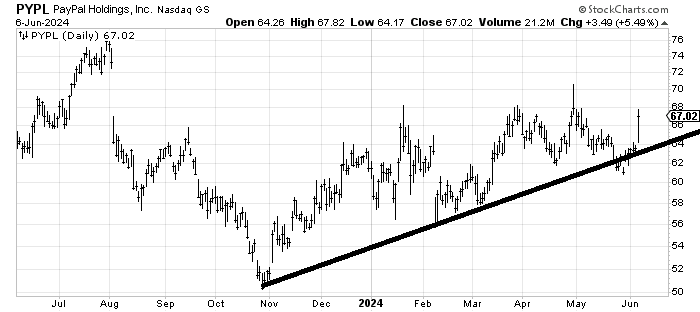
I was asked about PayPal (PYPL) a few weeks ago and I thought that break of the line around 62 was negative. I figured the stock would rally to 64 and that would be that. I was dead wrong as the break was a fake one and the basing continues.
Today’s Indicator
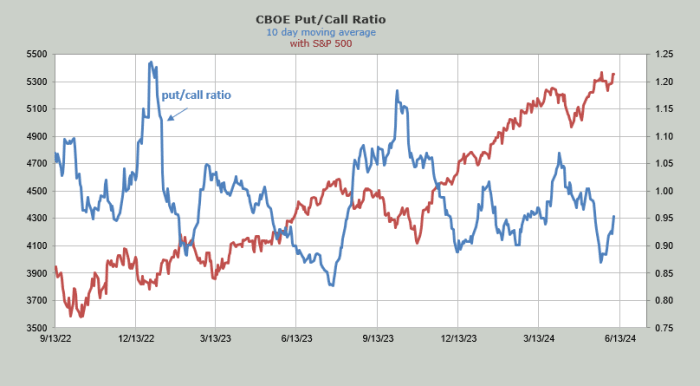
The ten day moving average of the put/call ratio is still rising.
Q&A/Reader’s Feedback
Helene welcomes your questions about Top Stocks and her charting strategy and techniques. Please send an email directly to Helene with your questions. However, please remember that TheStreet.com Top Stocks is not intended to provide personalized investment advice. Email Helene here.
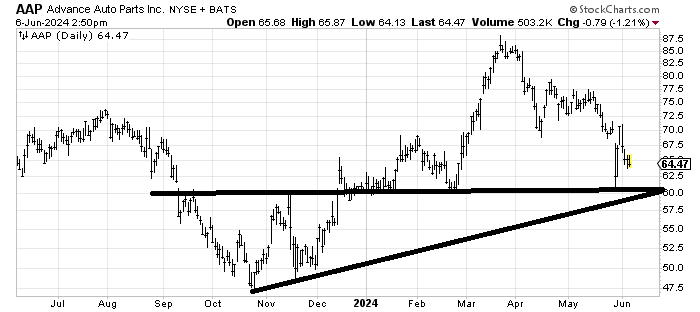
The chart of Advance Auto Parts (AAP) is what so many charts look like: they just drift lower, stabilize, drift, stabilize, etc. The stock has some decent support in that 60 area, I would expect a bounce from there but if you are looking for a base on the chart, it would need to spend a few months proving it can hold over this 57-60 area, much the same way it traded between 48 and 60 last fall for a few months.
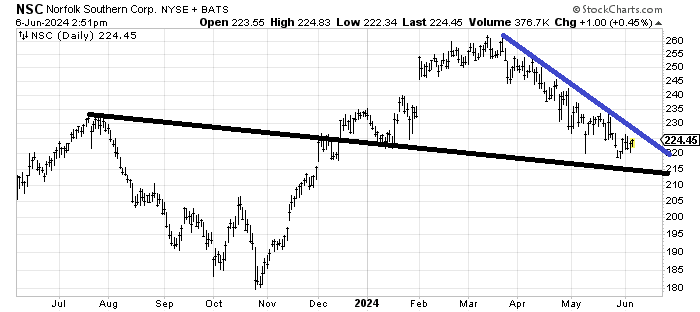
Norfolk Southern (NSC) barely bounced when it filled that gap from January. That is a red flag. And it hasn’t had a bounce worth playing since March. That’s probably one of the reasons why the Transports are so weak.
However this 215-220 area is the approximate 50% retracement from that rally off the November low so I would expect it to start trying to hold. The first thing it has to do to get started is cross that blue line. I would put the stock on my radar because it ought to start to improve.
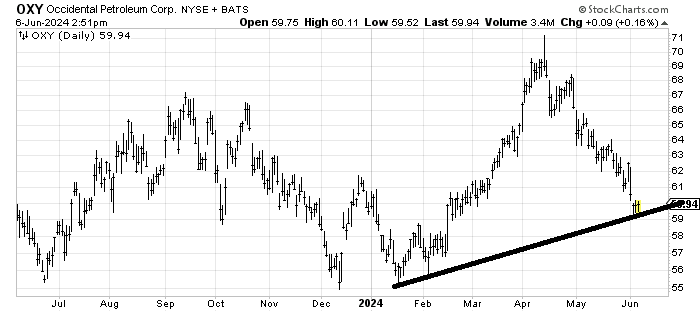
This is where Occidental Petroleum (OXY) ought to hold but the one thing we know is that every time in the last several years that OXY has come down to that 55-57 area it has found support and is buyable. So sure I'd like it to hold the line but that mid 50s area is where this stock is a buy.
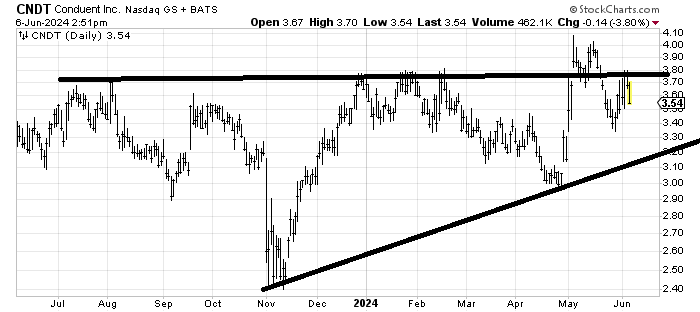
I tend to struggle with the charts of small cap stocks but I look at Conduent (CNDT) and I see a false breakout in early May, especially since it came back and rallied right back to 3.80 and died.
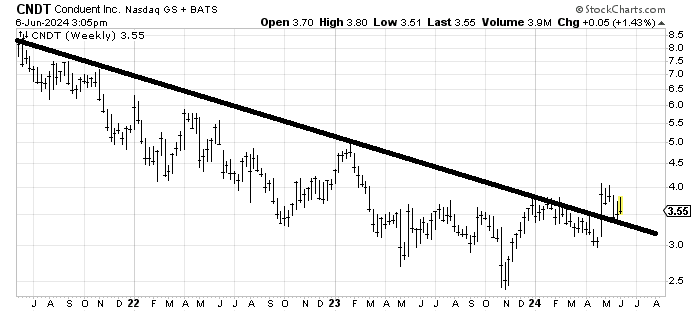
However, when I pull it back and look at the three year weekly chart I see a chart that has broken a long term downtrend so the stock ought to be buyable in the 3.20-3.25 area if you have patience.