ONEOK Is Positioned to Rally Further in the Weeks Ahead (original) (raw)
Let's check the charts and indicators of OKE.
ONEOK, Inc. (OKE) is rallying. The company owns and operates one of the country's biggest natural gas liquids (NGL) systems and is a leader in the gathering, processing, storage and transportation of natural gas. Can the rally last? Let's check out the charts and indicators.
In this daily bar chart of OKE, below, we can see the all too familiar decline from February down into the middle of March. Prices traded sideways from the middle of March to early April for a very shallow correction of the first move up from the low.
OKE has continued to rally and we can see a couple of price gaps telling us that buyers have been jumping in. The trading volume is down from the March levels but it is way above the levels before February.
The daily On-Balance-Volume (OBV) line has led the way on the upside and is at an all-time high. The OBV line is a coincident indicator and can also be a leading indicator. The trend-following Moving Average Convergence Divergence (MACD) oscillator gave a buy signal last month when it crossed above the zero line.
In this weekly bar chart of OKE, below, we can see some positive clues. Prices are moving up but still well below the declining 40-week moving average line. The weekly OBV line has soared to a new high for the move up and tells us that buyers are very aggressive. The MACD oscillator has just crossed to the upside below the zero line for a cover shorts buy signal.
In this daily Point and Figure chart of OKE, below, we can see the recent rally without price gaps and a potential upside price target in the $69 area.
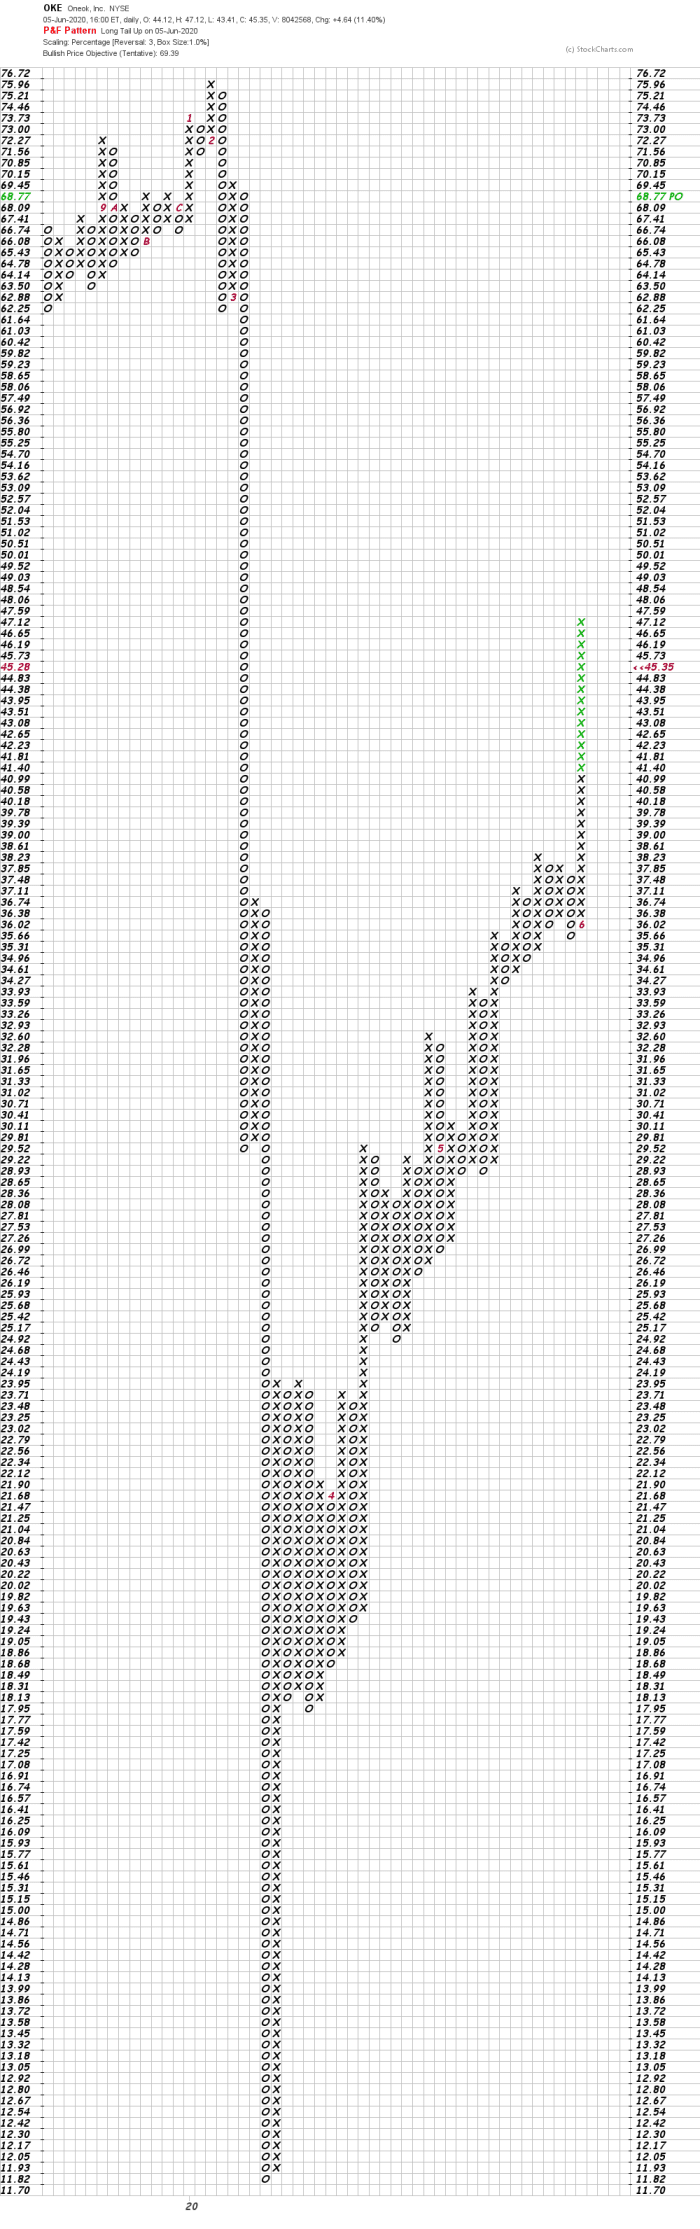
Bottom line strategy: Aggressive traders could go long OKE in the 45−45-45−40 area if available, risking a close below 35fornow.The35 for now. The 35fornow.The70 area is our potential price target for now.