Ventas Could Make a Low Now but a Base Pattern Will Need Considerable Work (original) (raw)
The charts of VTR have been hurt.
For his second "Executive Decision" segment of Mad Money Monday night, Jim Cramer sat down with Debra Cafaro, chairman and CEO of Ventas (VTR) , the medical REIT that has plummeted 60% so far this year. Shares of Ventas now yield nearly 14%.
Cafaro said that 2020 started off strong for Ventas, but since the coronavirus pandemic began there has been a lot of fear in the markets and stresses throughout the healthcare system. She reassured investors that Ventas is on a strong financial footing and that's why the company proceeded with its planned dividend.
When asked about the health of their residents, Cafaro said that all precautions are being taken at their facilities.
Let's check out the charts of VTR to see if they are being taken care of as well.
In this daily bar chart of VTR, below, we can see that prices began to weaken back in October, well before the issues with the coronavirus. Prices made a minor low in December and crawled slightly higher into February. Since late February prices plunged from near 65toaround65 to around 65toaround15. Trading volume soared the past two months telling us that investors voted with their feet and quickly and aggressively sold stock.
The On-Balance-Volume (OBV) line made a new low for the move down telling us that sellers of VTR have been more aggressive. The 12-day price momentum study in the lower panel of the chart shows that the decline is starting to slow but we do not have a bullish divergence that would give us more confidence in that observation.
In this weekly Japanese candlestick chart of VTR, below, we can see what might become a harami pattern (futures traders might call it an inside week). This potential reversal pattern is in the right location and so far the right pattern. We would still need confirmation with a bullish pattern or bar next week. Something to look forward to.
The 40-week moving average line is bearish. The weekly OBV line is bearish and the 12-week momentum study is just starting to slow.
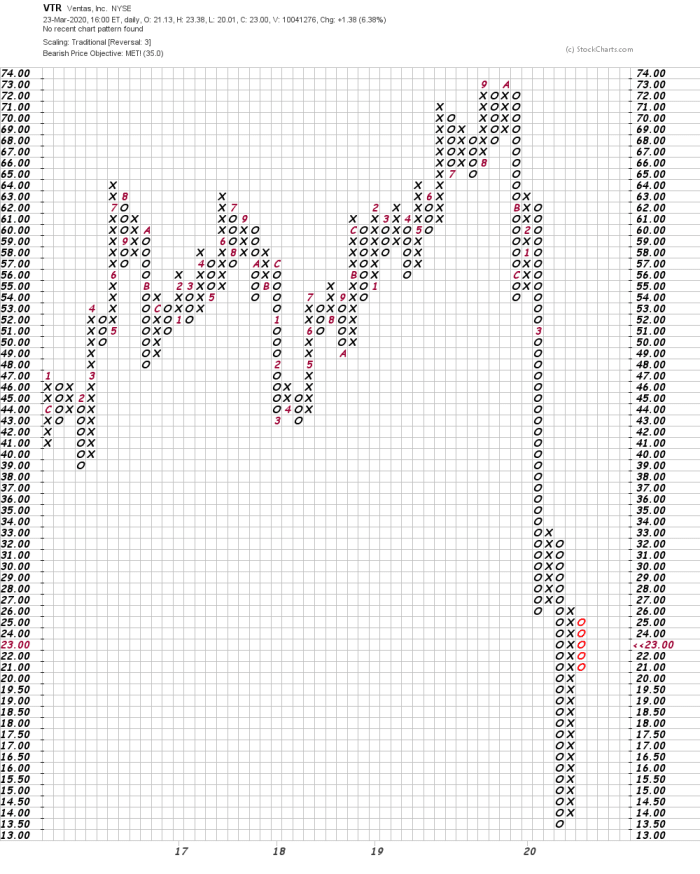
In this first Point and Figure chart of VTR, below, we used daily price data and a traditional plotting. A downside price target of $36 was reached and exceeded.
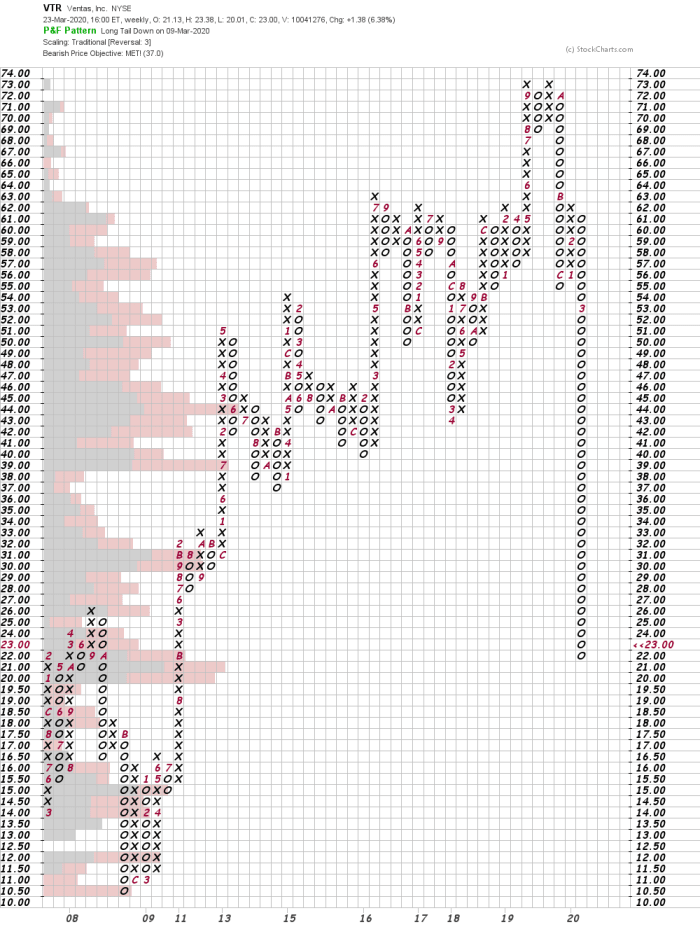
In this second Point and Figure chart of VTR, below, we used weekly close only data and a traditional plotting. The volume by price data (left scale) suggests that prices should find support (buying interest) in this area. Fingers crossed.
Bottom line strategy: The charts of VTR have been hurt. A low could be in the process this week but then we would want to see some fresh accumulation before being attracted to the long side.
Employees of TheStreet are prohibited from trading individual securities.