Somatic recording of GABAergic autoreceptor current in cerebellar stellate and basket cells - PubMed (original) (raw)
Somatic recording of GABAergic autoreceptor current in cerebellar stellate and basket cells
C Pouzat et al. J Neurosci. 1999.
Abstract
Patch-clamp recordings were performed from stellate and basket cells in rat cerebellar slices. Under somatic voltage clamp, short depolarizing pulses were applied to elicit action potentials in the axon. After the action potential, a bicuculline- and Cd2+-sensitive current transient was observed. A similar response was obtained when eliciting axonal firing by extracellular stimulation. With an isotonic internal Cl- solution, the peak amplitude of this current varied linearly with the holding potential, yielding an extrapolated reversal potential of -20 to 0 mV. Unlike synaptic or autaptic GABAergic currents obtained in the same preparation, the current transient had a slow rise-time and a low variability between trials. This current was blocked when 10 mM BAPTA was included in the recording solution. In some experiments, the current transient elicited axonal action potentials. The current transient was reliably observed in animals aged 12-15 d, with a mean amplitude of 82 pA at -70 mV, but was small and rare in the age group 29-49 d. Numerical simulations could account for all properties of the current transient by assuming that an action potential activates a distributed GABAergic conductance in the axon. The actual conductance is probably restricted to release sites, with an estimated mean presynaptic current response of 10 pA per site (-70 mV, age 12-15 d). We conclude that in developing rats, stellate and basket cell axons have a high density of GABAergic autoreceptors and that a sizable fraction of the corresponding current can be measured from the soma.
Figures
Fig. 1.
Voltage pulses elicit two distinct inward current signals with the same threshold. A, Leak-subtracted current traces obtained in an interneuron in response to successive voltage pulses (test potential, −20 mV; pulse frequency, 0.5 Hz) of increasing duration (0.1–1.0 msec, with 0.1 msec increments). For the three shortest pulses (0.1–0.3 msec, gray traces) no regenerative current was elicited. For all other stimuli (0.4–1 msec pulses,black traces), a regenerative Na+ current was obtained. For these stimuli, a slow, delayed current transient (mean amplitude, 118 pA) was also obtained. The _bottom panel_shows the same set of traces as the top panel, with different time and current amplitude scales, to illustrate the delayed current transient; Na+ currents are truncated. B, Peak amplitudes of (early) Na+ current (filled symbols) and of delayed current transient (open symbols) as a function of pulse duration, from three consecutive runs like the one illustrated in A. Both components are all-or-none, and they have the same threshold. The slight decrease of the Na+ current amplitude for pulse durations ≥0.5 msec is attributable to the fact that the peak of the Na+ conductance occurs after the pulses for shorter durations and during the pulses for longer durations. In the latter case, the corresponding Na+ current is reduced because the driving force is less.
Fig. 2.
The delayed current transient is abolished by bicuculline and by Cd2+. A, Two series of five representative current responses to depolarizing somatic voltage pulses (test potential, −30 mV; pulse duration, 0.8 msec; pulse frequency, 0.67 Hz), one obtained shortly after breaking into the whole-cell recording mode (black traces), and the other obtained after 7 min of whole-cell recording (gray traces). B, Decay of the peak amplitude of delayed inward current transients as a function of time in whole-cell recording, from the same cell as in A. Six points deviate strongly from the main decay curve: they correspond to traces that were contaminated with a spontaneous IPSC. C, In another cell, responses to depolarizing somatic voltage pulses (test potential, −30 mV; pulse duration, 1 msec; pulse frequency, 0.67 Hz), shortly after breaking into the whole-cell recording mode (black traces), and after 7 min of whole-cell recording (gray traces), in the presence of bicuculline. D, Plot of the peak amplitude of delayed inward current transients as a function of time, from the same cell as in C. E, F, Same experiment as in C and D, except that the current was here challenged by a solution containing 50 μ
m
Cd2+.
Fig. 3.
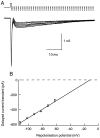
The delayed current transient depends linearly on potential. A, In this experiment the repolarization potential was changed from −110 to −60 mV. Depolarizing pulse was −20 mV (0.8 msec duration; repetition rate, 0.5 Hz). Traces were leak-subtracted. B, Plot of the peak amplitude of the delayed current transient (mean ± SEM) as a function of the repolarization potential, from four consecutive series such as the one shown in A. The regression line yields an extrapolated reversal potential of −13 mV.
Fig. 4.
The delayed current transient fades during prolonged whole-cell recording. A, Mean delayed current transient at three distinct periods of whole-cell recording, showing a marked decay during the initial 20 min period, followed by a stabilization at a low level (gray traces). B, Superimposed normalized traces at 1 and 20 min of whole-cell recording, showing that the reduction of amplitude with time is accompanied by a lengthening of the time to peak and a decrease of the time of decay. C, Kinetics of washout, from the same data (stimulation frequency, 0.25 Hz; series resistance during recording, 14 MΩ). D, E, Relation of time to peak (D, measured from the onset of the voltage pulse) and half decay time (E) on peak current amplitude. Data are from four cells as the one illustrated in A and B, and from a fifth cell in which the current was inhibited by addition of bicuculline. Each data point corresponds to averages of ∼10–20 traces with homogeneous amplitudes. Results for individual cells are indicated by specific symbols and have been fitted by individual regression lines. Note that the slopes of the regression lines are all negative in D and positive in E.
Fig. 5.
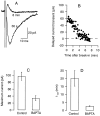
The delayed current transient is blocked by intracellular BAPTA. A, Mean delayed current transient (6 consecutive traces each; stimulation frequency, 0.25 Hz) recorded shortly after break-in (labeled 30 s) and after approximately 8 min of whole-cell recording. The pipette solution contained 10 m
m
BAPTA instead of the usual 1 m
m
EGTA. B, Time course of decay of the peak amplitude; series resistance during recording, 24 MΩ. C, D, Summary results for six control cells and six BAPTA-dialyzed cells, showing values (mean ± SEM) for the maximum peak delayed current transient (obtained during the first minutes of whole-cell recording) and for the time to half decay of this current. Average series resistance values were 24 ± 5 MΩ for the control cells and 36 ± 6 MΩ for the BAPTA-dialyzed cells.
Fig. 6.
The delayed current transient has slow onset and decay kinetics. A1, A2 , Examples of superimposed traces of delayed current transient (A1) and of spontaneous IPSCs taken in the same recording (A2). A3, Comparison between scaled averages of the autoreceptor current (continuous line, average of 142 sweeps) and of the spontaneous IPSCs (dotted line, average of 150 IPSCs; peak amplitude before scaling: 210 pA). B1, Examples of extracellularly evoked IPSCs, from another cell. B2, Here extracellular stimulations (at the time indicated by the star) were combined with somatic depolarizations. B3, Comparison of single evoked IPSCs obtained without (black trace) or with (gray trace) somatic depolarization. Rise-times are rapid in both cases. B4, A further series of evoked IPSCs, obtained with another location of the stimulation pipette. Here the evoked IPSCs are seen to superimpose on slowly rising delayed current transients.
Fig. 7.
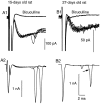
The delayed current transient is associated with enhanced axonal excitability. A1, Superimposed exemplar traces of delayed current transient; regenerative responses are present in three traces out of six. No such responses were seen in the presence of bicuculline (thick line; average trace). A2, Three further traces from the same experiment, shown with a less expanded vertical scale. Two of the traces contained large amplitude regenerative responses. B1, B2, Similar results obtained from an experiment with an older animal (27-d-old instead of 15-d-old in A1, A2). In this case the amplitude of the delayed current transient is small (∼30 pA), but regenerative responses are nevertheless observed before application of bicuculline.
Fig. 8.
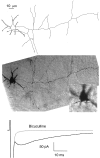
The delayed current transient does not require close contact or extensive overlap between the axonal and dendritic domains. Top, Camera lucida drawing of a basket cell (14-d-old animal) that was filled with neurobiotin during recording and processed for histology. The short thick neurites radiating from the soma are dendrites. The axon leaves the soma on the right and takes an almost straight course, sending several collaterals along the way. It is prolonged beyond the boundary of the drawing. The Purkinje cell layer is roughly horizontal and is located at the level of the tips of the axon collaterals at the lower boundary of the cell.Middle, Composite photograph from the same cell. In the lower scale photograph the dendrites are in focus; the axon collateral that appears to overlap with the dendritic field in the drawing of the_top panel_ is then not in focus. Insert, Blowup of the somatodendritic region with the axon collateral in focus. The shortest distance between axonal and dendritic domains in this cell was 2 μm. Bottom, Average responses to depolarizing pulses from the same cell, with and without bicuculline, showing the presence of a normal size, delayed current transient.
Fig. 9.
The delayed current transient can be obtained by extracellular stimulation. A, Morphology of the recorded interneuron (a basket cell) with Lucifer yellow staining. The Purkinje cell layer (PCL) corresponds roughly to the lower border of the field. The location of the stimulation pipette was alternated between a position 160 μm left of the soma of the recorded cell (Site 1) and another position 160 μm right of the soma of the recorded cell (Site 2; data not shown). B, Current traces obtained for different stimulation conditions. Series of pulses of 0.2 msec in duration and of various amplitudes were delivered with a frequency of 0.25 Hz at each site. Between each series of pulses, responses to somatic depolarizations were recorded. B1, A 600 μA stimulation at Site 1 failed to elicit any response. Only the stimulation artifact is obtained. B2, Increasing the stimulation intensity to 700 μA resulted in a large Na+ current (which just saturated the recording amplifier at 2 nA; data not shown) and a 90 pA delayed current transient. B3, Response to somatic stimulation. Na+ current amplitude = 1.75 nA (data not shown). Note the similarity of the amplitude and time course of the delayed current transient with that obtained by direct axon stimulation. B4, Lack of response at Site 2, with a stimulation intensity largely beyond the threshold at Site 1.
Fig. 10.
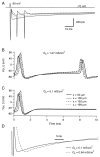
Currents recorded in response to synaptic conductance changes in passive cables. _A, B,_Dendrite-like cable voltage-clamped at the origin with localized synaptic inputs. The cable is uniform, with a length of 50 μm and a radius of 0.4 μm. Its electrical parameters are Ri = 100 Ω·cm, Rm = 50 kΩ·cm2, Cm = 1 μF/cm2. The synaptic conductance has a rise time of 1.1 msec and a bi-exponential decay with τfast = 9 msec, τslow = 40 msec, and a weight of 0.6 for the fast component. Six different peak conductances are simulated: 0.5, 1.0, 1.5, 2.0, 2.5, and 3 nS. The reversal potential of the synaptic current is at 0 mV. The origin of the cable is clamped at −70 mV. The conductance is located 10 μm away from the origin in A and 48 μm away in B. Inset, Scaled largest current (continuous line) and scaled smallest current (dashed line); Calibration, 5 msec. C, Axon-like cable voltage-clamped at the origin with homogeneous synaptic input. The cable is 200 μm long and has a radius of 0.25 μm. Its electrical parameters are the same as in A and B. The synaptic conductance has a rise time of 1.5 msec and the same bi-exponential decay as above. Six different autoreceptor conductance densities are simulated: 0.25, 0.64, 0.89, 1.27, 1.91, and 2.55 mS/cm2. As above, the reversal potential of the synaptic conductance is 0 mV, and the origin is maintained at −70 mV. As the autoreceptor current density increases, the time to peak decreases from 3.5 to 2.0 msec, whereas the half decay time increases from 14.2 to 21.8 msec. Inset, As above, scaled largest (continuous line) and smallest (dashed line) currents. Calibration, 5 msec.
Fig. 11.
Axon-like cable with homogeneous autoreceptor current input. Simulations of a cable 200 μm long with a radius of 0.25 μm. The parameters describing the passive electrical properties of the cable are as in Figure 10. The cable has a uniform Na+ conductance density (50 mS/cm2 with a reversal potential at +90 mV) and a uniform K+ conductance density (400 mS/cm2 with a reversal potential at −95 mV). The kinetic parameters of these conductances are given in Materials and Methods. Results of simulations are displayed with different uniform autoreceptor conductance densities. The kinetic parameters and reversal potential of the autoreceptor conductance are the same as in Figure 10. A, Currents elicited by a short voltage pulse (duration, 0.5 msec; amplitude, 50 mV) at the origin of the cable. Traces are “leak-subtracted” (see Materials and Methods). The autoreceptor conductance is activated 1 msec after the beginning of the pulse. Autoreceptor densities of 0.64 mS/cm2 (dashed trace), 1.27 mS/cm2 (continuous trace with the two secondary spikes), 2.55 mS/cm2 (gray trace), and 5.1 mS/cm2 (continuous trace without secondary spikes) are represented. B, C, Voltage time courses at four different locations along the cable with two different autoreceptor conductance densities: 1.27 mS/cm2 for B and 5.1 mS/cm2 for C. Here only 10 msec are shown. The first spike is the one evoked by the voltage pulse at the origin. The second, antidromic spike in B corresponds to the first of the two secondary spikes in A. D, Peak-scaled traces corresponding to autoreceptor conductance density values of 0.64 mS/cm2(dashed line) and 5.1 mS/cm2(continuous line). Times to peak are, respectively, 8.4 and 3.6 msec, and half-decay times are 25 and 28 msec. Calibration, 5 msec.
Fig. 12.
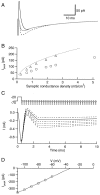
Effects of active conductances on the kinetics and peak amplitude of the delayed current transients. A, Superimposed traces representing simulations of the delayed current transient for a 200 μm long homogeneous cable containing an autoreceptor conductance density of 0.64 mS/cm2, without (dashed trace, from Fig. 10C) and with (thin continuous trace, from Fig. 11A) voltage-dependent conductances. The thick trace represents the subtraction of the currents obtained with and without autoreceptors, in the presence of voltage-dependent conductances. B, Peak delayed current transient as a function of autoreceptor conductance density, as calculated with the analytical model of a semi-infinite passive cable (dashed line), with the numerical simulation of a passive cable (triangles, from Fig. 10C) and with the numerical simulation of an active cable (circles, from Fig. 11A). C, Simulations of the experiments performed to estimate the reversal potential of the delayed current transient. Top part, schematic representation of the voltage command applied at the origin of the cable. Bottom part, current traces obtained with an autoreceptor conductance density of 5.1 mS/cm2(these traces are leak-subtracted). D, Plot of the peak delayed current transient versus repolarization potential. The extrapolated reversal potential is −33 mV.
Similar articles
- Inhibitory synaptic currents in stellate cells of rat cerebellar slices.
Llano I, Gerschenfeld HM. Llano I, et al. J Physiol. 1993 Aug;468:177-200. doi: 10.1113/jphysiol.1993.sp019766. J Physiol. 1993. PMID: 7504726 Free PMC article. - Serotonin drives a novel GABAergic synaptic current recorded in rat cerebellar purkinje cells: a Lugaro cell to Purkinje cell synapse.
Dean I, Robertson SJ, Edwards FA. Dean I, et al. J Neurosci. 2003 Jun 1;23(11):4457-69. doi: 10.1523/JNEUROSCI.23-11-04457.2003. J Neurosci. 2003. PMID: 12805286 Free PMC article. - Autaptic inhibitory currents recorded from interneurones in rat cerebellar slices.
Pouzat C, Marty A. Pouzat C, et al. J Physiol. 1998 Jun 15;509 ( Pt 3)(Pt 3):777-83. doi: 10.1111/j.1469-7793.1998.777bm.x. J Physiol. 1998. PMID: 9596799 Free PMC article. - Post-episode depression of GABAergic transmission in spinal neurons of the chick embryo.
Chub N, O'Donovan MJ. Chub N, et al. J Neurophysiol. 2001 May;85(5):2166-76. doi: 10.1152/jn.2001.85.5.2166. J Neurophysiol. 2001. PMID: 11353031 - Control of interneurone firing pattern by axonal autoreceptors in the juvenile rat cerebellum.
Mejia-Gervacio S, Marty A. Mejia-Gervacio S, et al. J Physiol. 2006 Feb 15;571(Pt 1):43-55. doi: 10.1113/jphysiol.2005.101675. Epub 2005 Dec 8. J Physiol. 2006. PMID: 16339174 Free PMC article.
Cited by
- Readily releasable pool of synaptic vesicles measured at single synaptic contacts.
Trigo FF, Sakaba T, Ogden D, Marty A. Trigo FF, et al. Proc Natl Acad Sci U S A. 2012 Oct 30;109(44):18138-43. doi: 10.1073/pnas.1209798109. Epub 2012 Oct 16. Proc Natl Acad Sci U S A. 2012. PMID: 23074252 Free PMC article. - Electrophysiology of ionotropic GABA receptors.
Sallard E, Letourneur D, Legendre P. Sallard E, et al. Cell Mol Life Sci. 2021 Jul;78(13):5341-5370. doi: 10.1007/s00018-021-03846-2. Epub 2021 Jun 1. Cell Mol Life Sci. 2021. PMID: 34061215 Free PMC article. Review. - Counting Vesicular Release Events Reveals Binomial Release Statistics at Single Glutamatergic Synapses.
Malagon G, Miki T, Llano I, Neher E, Marty A. Malagon G, et al. J Neurosci. 2016 Apr 6;36(14):4010-25. doi: 10.1523/JNEUROSCI.4352-15.2016. J Neurosci. 2016. PMID: 27053208 Free PMC article. - Dynamic Factors for Transmitter Release at Small Presynaptic Boutons Revealed by Direct Patch-Clamp Recordings.
Kawaguchi SY. Kawaguchi SY. Front Cell Neurosci. 2019 Jun 12;13:269. doi: 10.3389/fncel.2019.00269. eCollection 2019. Front Cell Neurosci. 2019. PMID: 31249514 Free PMC article. Review. - Presynaptic, extrasynaptic and axonal GABAA receptors in the CNS: where and why?
Kullmann DM, Ruiz A, Rusakov DM, Scott R, Semyanov A, Walker MC. Kullmann DM, et al. Prog Biophys Mol Biol. 2005 Jan;87(1):33-46. doi: 10.1016/j.pbiomolbio.2004.06.003. Prog Biophys Mol Biol. 2005. PMID: 15471589 Free PMC article. Review.
References
- Barbour B, Häusser M. Intersynaptic diffusion of neurotransmitter. Trends Neurosci. 1997;20:377–384. - PubMed
- Bishop GA. An analysis of HRP-filled basket cell axons in the cat’s cerebellum. Anat Embryol. 1993;188:287–297. - PubMed
- Clements JD. Transmitter timecourse in the synaptic cleft: its role in central synaptic function. Trends Neurosci. 1996;19:163–171. - PubMed
Publication types
MeSH terms
Substances
LinkOut - more resources
Full Text Sources


