Human SWI-SNF component BRG1 represses transcription of the c-fos gene - PubMed (original) (raw)
Human SWI-SNF component BRG1 represses transcription of the c-fos gene
D J Murphy et al. Mol Cell Biol. 1999 Apr.
Abstract
Yeast and mammalian SWI-SNF complexes regulate transcription through active modification of chromatin structure. Human SW-13 adenocarcinoma cells lack BRG1 protein, a component of SWI-SNF that has a DNA-dependent ATPase activity essential for SWI-SNF function. Expression of BRG1 in SW-13 cells potentiated transcriptional activation by the glucocorticoid receptor, which is known to require SWI-SNF function. BRG1 also specifically repressed transcription from a transfected c-fos promoter and correspondingly blocked transcriptional activation of the endogenous c-fos gene. Mutation of lysine residue 798 in the DNA-dependent ATPase domain of BRG1 significantly reduced its ability to repress c-fos transcription. Repression by BRG1 required the cyclic AMP response element of the c-fos promoter but not nearby binding sites for Sp1, YY1, or TFII-I. Using human C33A cervical carcinoma cells, which lack BRG1 and also express a nonfunctional Rb protein, transcriptional repression by BRG1 was weak unless wild-type Rb was also supplied. Interestingly, Rb-dependent repression by BRG1 was found to take place through a pathway that is independent of transcription factor E2F.
Figures
FIG. 1
Transcriptional repression by BRG1. SW-13 cells were transfected by the calcium phosphate method with pCMV-BRG1 and either pfos-CAT, EF-1α-luciferase, or pSV2-CAT (A); pCMV VP16-E2, pCMV-BRG1, and pTKM (indicated as BPV-E2 (B); pGR, pCMV-BRG1, and pMSG-CAT (indicated as MMTV) (C). Cells were harvested 48 h after transfection and assayed for CAT or luciferase activity as described in Materials and Methods. Two micrograms of each reporter plasmid and 4 μg of each expression plasmid were used, except in panel B, where 2 μg of pCMV-BRG1 was used. (A) Average assay values for the promoter plasmids in the absence of BRG1 were 80,000 cpm (pfos-CAT), 400,000 light units (EF-1α-luciferase), and 100,000 cpm (pSV2-CAT). Data from BRG1-expressing cells are plotted as a percentage of these averages. The amount of pCMV-BRG1 transfected is indicated below each bar (in micrograms). The data are averages of three to six (A), three (B), or four (C) independent experiments, each performed in duplicate. dex, 1 μM dexamethasone. SV40, simian virus 40; CMV, cytomegalovirus.
FIG. 2
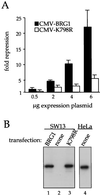
Repression requires the DNA-dependent ATPase domain of BRG1. (A) SW-13 cells were transfected with the indicated expression plasmids along with 2 μg of pfos-CAT. Cells were harvested after 48 h and assayed for CAT activity as described in Materials and Methods. Data (averages of six independent experiments) are plotted as fold repression calculated against pfos-CAT cotransfected with the parental pCMV5 expression plasmid. (B) SW-13 cells were transfected with 6 μg of pCMV-BRG1 or pCMV-K798R or left untransfected. After 48 h, they were harvested and subjected to Western blot analysis using anti-BRG1 antibody J1 (lanes 1 to 3) as described in Materials and Methods. HeLa cells were assayed similarly for endogenous BRG1 protein (lane 4).
FIG. 3
BRG1 blocks induction of the endogenous c-fos gene. (A) tTa-induced expression of BRG1. SW-13 cells were infected with the indicated viruses and analyzed by Western blot analysis using anti-BRG1 antibody J1. (B) SW-13 cells were uninfected (lanes 1 and 5), infected with AdtTa alone (lanes 2 and 6), or infected with AdtTa in combination with either AdBRG1 (lanes 3 and 7) or AdK798R (lanes 4 and 8). Tetracycline (2.5 μg/ml), which abolishes tTA activator activity, was added 4 h p.i. (lanes 5 to 8). The MOI was 60 for AdtTa and 240 for AdBRG1 and AdK798R. Infection with AdtTa alone at an MOI of 300 produced no effect on c-fos induction (data not shown). After 48 h, cells were harvested for RNase protection assay with c-fos and GAPDH probes as described in Materials and Methods. RNase-resistant products were separated by electrophoresis through urea-polyacrylamide. They were visualized and quantified by using a PhosphorImager (Molecular Dynamics). The data shown are representative of three independent experiments (two in the case of the tetracycline addition experiments). (C) Cells were infected with the indicated viruses (same MOI as in panel A) and transfected on the following day with pfos-CAT or EF-1α-luciferase. After an additional 40 h, the cells were harvested and assayed for CAT or luciferase activity. Data are plotted as fold repression averaged from three independent experiments. wt, wild type.
FIG. 4
Time course of BRG1 protein expression and BRG1-induced repression. SW-13 cells were infected with AdBRG1 plus AdtTa as described in the legend to Fig. 3 and incubated for the indicated times in the presence or absence of 2.5-μg/ml tetracycline (TET). Cells were stimulated with forskolin for 45 min prior to harvesting. Harvested cells were processed for Western blot analysis of BRG1 (A) and RNase protection assay of c-fos mRNA (B). For lanes 13 of A and B, cells were first incubated for 48 h in the absence of tetracycline, and then tetracycline was added for the remaining 12 h of the 60-h period. For lanes 16 of A and B, cells were first incubated for 48 h in the absence of tetracycline, and then tetracycline was added for the remaining 24 h of the 72-h period. The designations 12h and 24h indicate this.
FIG. 5
Mutational analysis of the c-fos promoter. (A) The −76 to +10 sequence of the mouse c-fos promoter region is shown. Bars below the sequence indicate the binding sequences of the indicated transcription factors. There are two adjacent sites for YY1, whose core CCAT sequences are indicated. Except for SP1, all of the indicated factors have been demonstrated to bind to the mouse c-fos promoter. The SP1 site is a perfect match to the consensus SP1 binding site, and as shown here, mutation of this site results in a significant decrease in promoter activity. Sequences of pfos-CAT derivatives are also shown, with a solid line representing the wild-type sequence. (B) SW-13 cells were cotransfected with pCMV-BRG1 (3 μg) and pfos-CAT (2 μg) derivatives with mutations in the TATA box (pm87), ATF/CREB site (pm28), overlapping YY1 and TFII-I sites (pm27), or consensus SP1 site (pm 82). Cells were harvested 48 h after transfection and assayed for CAT activity. Data are plotted as percent wild-type promoter activity to show the effect of each mutation in the absence and the presence of BRG1. Each mutant was tested along with the wild-type promoter three to six independent times, and the percent wild-type activities were averaged. A dash for fold repression indicates that the promoter-only value divided by CMV-BRG1 equals 1. (C) SW-13 cells were transfected with the indicated fosCAT derivatives along with CMV-BRG1 and assayed as described above. This experiment was performed four times, each time in duplicate.
FIG. 6
Repression of the c-fos promoter by BRG1 depends on Rb. C33A cells were transfected with the indicated expression constructs, along with 2 μg of pfos-CAT. Cells were harvested after 48 h and assayed for CAT activity. The amount of input DNA (in micrograms) for each expression construct is given below each bar. The activity of pfos-CAT transfected along with the pCMV5 parental expression vector served as 100% activity for calculation of percent promoter activity. The data are presented as averages from five independent experiments. CMV, cytomegalovirus.
FIG. 7
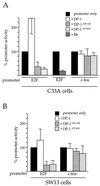
Repression of c-fos by BRG1 is E2F independent. C33A (A) or SW-13 (B) cells were transfected with 5 μg of the indicated expression plasmids along with the indicated promoter constructs. Cells were harvested 48 h after transfection and assayed for CAT activity. The activity of pfos-CAT or E2-CAT transfected along with the pCMV5 parental expression vector served as 100% activity for calculation of percent promoter activity. The data are presented as averages from three independent experiments.
Similar articles
- Role of the LXCXE binding site in Rb function.
Dahiya A, Gavin MR, Luo RX, Dean DC. Dahiya A, et al. Mol Cell Biol. 2000 Sep;20(18):6799-805. doi: 10.1128/MCB.20.18.6799-6805.2000. Mol Cell Biol. 2000. PMID: 10958676 Free PMC article. - Functional selectivity of recombinant mammalian SWI/SNF subunits.
Kadam S, McAlpine GS, Phelan ML, Kingston RE, Jones KA, Emerson BM. Kadam S, et al. Genes Dev. 2000 Oct 1;14(19):2441-51. doi: 10.1101/gad.828000. Genes Dev. 2000. PMID: 11018012 Free PMC article. - Novel Interactions between the Human T-Cell Leukemia Virus Type 1 Antisense Protein HBZ and the SWI/SNF Chromatin Remodeling Family: Implications for Viral Life Cycle.
Alasiri A, Abboud Guerr J, Hall WW, Sheehy N. Alasiri A, et al. J Virol. 2019 Jul 30;93(16):e00412-19. doi: 10.1128/JVI.00412-19. Print 2019 Aug 15. J Virol. 2019. PMID: 31142665 Free PMC article. - The mammalian SWI/SNF complex and the control of cell growth.
Muchardt C, Yaniv M. Muchardt C, et al. Semin Cell Dev Biol. 1999 Apr;10(2):189-95. doi: 10.1006/scdb.1999.0300. Semin Cell Dev Biol. 1999. PMID: 10441072 Review. - The Rb/chromatin connection and epigenetic control: opinion.
Ferreira R, Naguibneva I, Pritchard LL, Ait-Si-Ali S, Harel-Bellan A. Ferreira R, et al. Oncogene. 2001 May 28;20(24):3128-33. doi: 10.1038/sj.onc.1204337. Oncogene. 2001. PMID: 11420729 Review.
Cited by
- Brg-1 mediates the constitutive and fenretinide-induced expression of SPARC in mammary carcinoma cells via its interaction with transcription factor Sp1.
Xu YZ, Heravi M, Thuraisingam T, Di Marco S, Muanza T, Radzioch D. Xu YZ, et al. Mol Cancer. 2010 Aug 5;9:210. doi: 10.1186/1476-4598-9-210. Mol Cancer. 2010. PMID: 20687958 Free PMC article. - Repression of c-Myc and inhibition of G1 exit in cells conditionally overexpressing p300 that is not dependent on its histone acetyltransferase activity.
Baluchamy S, Rajabi HN, Thimmapaya R, Navaraj A, Thimmapaya B. Baluchamy S, et al. Proc Natl Acad Sci U S A. 2003 Aug 5;100(16):9524-9. doi: 10.1073/pnas.1633700100. Epub 2003 Jul 25. Proc Natl Acad Sci U S A. 2003. PMID: 12883011 Free PMC article. - Prostate cancer exploits BRD9-driven metabolic reprogramming to shape the aggressive phenotype.
Lv Y, Mo X, Zhang R, Peng Y, Feng T, Zhang Y, Song G, Ge L, Liu Y, Yang G, Wang L. Lv Y, et al. Cell Death Dis. 2025 Apr 22;16(1):326. doi: 10.1038/s41419-025-07561-9. Cell Death Dis. 2025. PMID: 40263302 Free PMC article. - Remodeling of chromatin structure in senescent cells and its potential impact on tumor suppression and aging.
Adams PD. Adams PD. Gene. 2007 Aug 1;397(1-2):84-93. doi: 10.1016/j.gene.2007.04.020. Epub 2007 May 1. Gene. 2007. PMID: 17544228 Free PMC article. Review.
References
- Andersson S, Davis D L, Dahlback H, Jornvall H, Russell D W. Cloning, structure, and expression of the mitochondrial cytochrome P-450 sterol 26-hydroxylase, a bile acid biosynthetic enzyme. J Biol Chem. 1989;264:8222–8229. - PubMed
- Ausubel F, Brent R, Kingston R E, Moore D D, Seidman J G, Smith J A, and Struhl K. Current protocols in molecular biology. New York, N.Y: John Wiley & Sons, Inc.; 1989.
- Bravo R. Genes induced during the G0/G1 transition in mouse fibroblasts. Semin Cancer Biol. 1990;1:37–46. - PubMed
Publication types
MeSH terms
Substances
LinkOut - more resources
Full Text Sources
Other Literature Sources
Miscellaneous


