Control of mitotic spindle position by the Saccharomyces cerevisiae formin Bni1p - PubMed (original) (raw)
Control of mitotic spindle position by the Saccharomyces cerevisiae formin Bni1p
L Lee et al. J Cell Biol. 1999.
Abstract
Alignment of the mitotic spindle with the axis of cell division is an essential process in Saccharomyces cerevisiae that is mediated by interactions between cytoplasmic microtubules and the cell cortex. We found that a cortical protein, the yeast formin Bni1p, was required for spindle orientation. Two striking abnormalities were observed in bni1Delta cells. First, the initial movement of the spindle pole body (SPB) toward the emerging bud was defective. This phenotype is similar to that previously observed in cells lacking the kinesin Kip3p and, in fact, BNI1 and KIP3 were found to be in the same genetic pathway. Second, abnormal pulling interactions between microtubules and the cortex appeared to cause preanaphase spindles in bni1Delta cells to transit back and forth between the mother and the bud. We therefore propose that Bni1p may localize or alter the function of cortical microtubule-binding sites in the bud. Additionally, we present evidence that other bipolar bud site determinants together with cortical actin are also required for spindle orientation.
Figures
Figure 1
Growth phenotypes and nuclear segregation in bni1Δ and double mutant strains. (a) Growth phenotypes. The indicated strains were grown at 23°C to saturation, diluted to the same starting concentration, and then spotted onto medium in fivefold serial dilutions. Plates were incubated for 48 h, except 14°C plates which were incubated for 7 d. Benomyl sensitivity was tested at 5 μg/ml benomyl. Wild-type cells were sensitive to benomyl at 20 μg/ml. (b) Nuclear segregation. Strains were grown to early log phase at 23°C, shifted to the indicated temperatures for 3 h, and then stained with DAPI. At least 300 cells were counted for each sample.
Figure 2
Spindle orientation in BNI1 (a), bni1Δ (b), and bni1-CTΔ1 (c) strains. Early log phase cultures were incubated at either 23° or 37°C for 3 h. The results shown are from the 37°C samples. The histograms show the percentages of cells with spindles oriented to the mother–bud axis at angles of 0°–30°, 30°– 60°, and 60°–90°. 180 cells were examined for each sample. The mean spindle orientation angles are 23.7° (BNI1), 42.8° (bni1Δ), and 39.5° (bni1-CTΔ1) and the mean SPB-neck distances are 0.7, 1.0, and 1.1 μm, respectively. The mean spindle orientation angle of the bni1Δ and the bni1-CTΔ1 strains were significantly different from that of the control (t test, P < 0.0001 for both). For samples maintained at 23°C, the mean spindle orientation angles were 25.2° (BNI1), 39.1° (bni1Δ), and 33.3° (bni1-CTΔ1). The mean angles of the bni1Δ and the bni1-CTΔ1 strains at 23°C were also significantly different from the control strain (t test, P < 0.0001 and P = 0.0005, respectively).
Figure 3
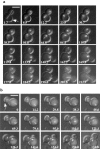
SPB movement toward the incipient bud in posttelophase wild-type and bni1Δ cells. Representative images from time-lapse series of BNI1 (a) and bni1Δ (b) cells. Microtubules are labeled in vivo with GFP–Tub1. Cells were imaged from the time of maximal anaphase spindle elongation until SPB separation or longer. At each time indicated a DIC image and six fluorescent images separated by 0.5 μm in the z focal plane were acquired and overlaid. White arrow, the incipient bud site of the cell of interest. In the BNI1 strain, spindle disassembly is at 8.9 min, bud emergence is at 116 min, SPB separation is at 162.6 min, spindle insertion is at 198.6 min, and spindle elongation is at 212.9 min. In the bni1Δ strain, spindle disassembly is at 0 min, bud emergence is at 141.6 min, and SPB separation is at 173.8 min. The complete data set for each cell is plotted in Fig. 4. Bar, 5 μm.
Figure 4
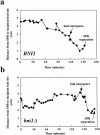
Spindle pole body migration in BNI1 (a) and bni1Δ (b) cells from spindle disassembly to SPB duplication. The distance between the SPB and the incipient bud site is measured at each time point. At time points before bud emergence the position of the presumptive bud site was determined by comparison to later time points. Images for a subset of the time points acquired are shown in Fig. 3.
Figure 5
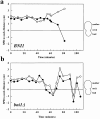
Preanaphase spindle movement in BNI1 and bni1Δ cells. The distance between each SPB and the bud neck is measured at 5–10 min intervals. Cells were observed from SPB separation through spindle insertion. Images were acquired as in Fig. 3. Closed circles represent the SPB that is initially proximal to the bud and open circles represent the other SPB. The bud neck is at 0 μm, positive numbers are distances from the neck in the mother cell, and negative numbers are distances from the neck in the daughter cell. 0 min in Fig. 5 b corresponds to 97.9 min in Fig. 6.
Figure 6
Defective preanaphase spindle movement in a bni1Δ cell: transiting of the short spindle between the mother and daughter cell. White arrow, the cell of interest. Images were collected as in Fig. 3. The images shown are a subset of the time points acquired and plotted in Fig. 5 b. Bud emergence and SPB separation occur at 61.6 and 97.9 min, respectively. Transiting of the preanaphase spindle into the bud is observed at 157.0 and 188.3 min, respectively, whereas transiting into the mother is observed at 167.5 and 193.4 min, respectively. Bar, 5 μm.
Figure 7
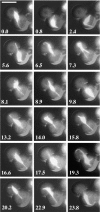
Relationship between preanaphase spindle transiting and cytoplasmic microtubules interactions with the cell cortex: time-lapse series of a preanaphase bni1Δ cell. At each time indicated a DIC image and eight to 10 fluorescent images separated by 0.3 μm in the z focal plane were acquired and overlaid. To enhance the visualization of cytoplasmic microtubules, images were collected using 2 × 2 binning and 400–700-ms exposures. The light from the mercury lamp was attenuated to one-eighth of the maximal intensity. This resulted in overexposure of the spindle microtubules. Spindle transits into the mother cell were observed at 0.8, 9.8, 17.5, and 23.8 min, and transits into the bud were observed at 7.3, 14.0, and 20.2 min. In all cases, spindle transit was correlated with shortening of the cytoplasmic microtubules which maintained contact with the cell cortex. Bar, 5 μm.
Figure 8
Anaphase kinetics in BNI1 and bni1Δ cells. Time-lapse series of BNI1 and bni1Δ cells collected from before anaphase through the completion of anaphase. Images were collected as in Fig. 3. The distance between the two SPBs was measured at each time point and plotted versus time.
Figure 9
The role of actin in spindle orientation. Early log phase wild-type cells expressing Nuf2p–GFP were treated with DMSO (a) or Lat-A (b) for 5 min. Cells were fixed and spindle orientation was measured as in Fig. 2. Spindle orientation angles are shown on the x axis. A sample from each culture was stained with rhodamine-phalloidin to visualize actin. Spindle orientation angles were measured in sla1ΔSH3#3 (d) and isogenic wild-type strains (c). Spindles were visualized by indirect immunofluorescence using the anti-tubulin mAb, YOL1/34. sla1ΔSH3#3 (f) and isogenic wild-type strains (e) were stained with rhodamine-phalloidin to visualize actin structures. Bar, 3 μm.
Similar articles
- Dynamic positioning of mitotic spindles in yeast: role of microtubule motors and cortical determinants.
Yeh E, Yang C, Chin E, Maddox P, Salmon ED, Lew DJ, Bloom K. Yeh E, et al. Mol Biol Cell. 2000 Nov;11(11):3949-61. doi: 10.1091/mbc.11.11.3949. Mol Biol Cell. 2000. PMID: 11071919 Free PMC article. - Kinesin-related KIP3 of Saccharomyces cerevisiae is required for a distinct step in nuclear migration.
DeZwaan TM, Ellingson E, Pellman D, Roof DM. DeZwaan TM, et al. J Cell Biol. 1997 Sep 8;138(5):1023-40. doi: 10.1083/jcb.138.5.1023. J Cell Biol. 1997. PMID: 9281581 Free PMC article. - Mitotic spindle positioning in Saccharomyces cerevisiae is accomplished by antagonistically acting microtubule motor proteins.
Cottingham FR, Hoyt MA. Cottingham FR, et al. J Cell Biol. 1997 Sep 8;138(5):1041-53. doi: 10.1083/jcb.138.5.1041. J Cell Biol. 1997. PMID: 9281582 Free PMC article. - Spindle polarity in S. cerevisiae: MEN can tell.
Smeets MF, Segal M. Smeets MF, et al. Cell Cycle. 2002 Sep-Oct;1(5):308-11. doi: 10.4161/cc.1.5.143. Cell Cycle. 2002. PMID: 12461289 Review. - Control of spindle polarity and orientation in Saccharomyces cerevisiae.
Segal M, Bloom K. Segal M, et al. Trends Cell Biol. 2001 Apr;11(4):160-6. doi: 10.1016/s0962-8924(01)01954-7. Trends Cell Biol. 2001. PMID: 11306295 Review.
Cited by
- Bud6 directs sequential microtubule interactions with the bud tip and bud neck during spindle morphogenesis in Saccharomyces cerevisiae.
Segal M, Bloom K, Reed SI. Segal M, et al. Mol Biol Cell. 2000 Nov;11(11):3689-702. doi: 10.1091/mbc.11.11.3689. Mol Biol Cell. 2000. PMID: 11071900 Free PMC article. - FORMIN a link between kinetochores and microtubule ends.
Mao Y. Mao Y. Trends Cell Biol. 2011 Nov;21(11):625-9. doi: 10.1016/j.tcb.2011.08.005. Epub 2011 Sep 13. Trends Cell Biol. 2011. PMID: 21920754 Free PMC article. Review. - Entamoeba histolytica encodes unique formins, a subset of which regulates DNA content and cell division.
Majumder S, Lohia A. Majumder S, et al. Infect Immun. 2008 Jun;76(6):2368-78. doi: 10.1128/IAI.01449-07. Epub 2008 Mar 17. Infect Immun. 2008. PMID: 18347041 Free PMC article. - Pronounced and extensive microtubule defects in a Saccharomyces cerevisiae DIS3 mutant.
Smith SB, Kiss DL, Turk E, Tartakoff AM, Andrulis ED. Smith SB, et al. Yeast. 2011 Nov;28(11):755-69. doi: 10.1002/yea.1899. Epub 2011 Sep 15. Yeast. 2011. PMID: 21919057 Free PMC article. - Control of Formin Distribution and Actin Cable Assembly by the E3 Ubiquitin Ligases Dma1 and Dma2.
Juanes MA, Piatti S. Juanes MA, et al. Genetics. 2016 Sep;204(1):205-20. doi: 10.1534/genetics.116.189258. Epub 2016 Jul 22. Genetics. 2016. PMID: 27449057 Free PMC article.
References
Publication types
MeSH terms
Substances
LinkOut - more resources
Full Text Sources
Other Literature Sources
Molecular Biology Databases


