Network oscillations generated by balancing graded asymmetric reciprocal inhibition in passive neurons - PubMed (original) (raw)
Network oscillations generated by balancing graded asymmetric reciprocal inhibition in passive neurons
Y Manor et al. J Neurosci. 1999.
Abstract
We describe a novel mechanism by which network oscillations can arise from reciprocal inhibitory connections between two entirely passive neurons. The model was inspired by the activation of the gastric mill rhythm in the crab stomatogastric ganglion by the modulatory commissural ganglion neuron 1 (MCN1), but it is studied here in general terms. One model neuron has a linear current-voltage (I-V) curve with a low (L) resting potential, and the second model neuron has a linear current-voltage curve with a high (H) resting potential. The inhibitory connections between them are graded. There is an extrinsic modulatory excitatory input to the L neuron, and the L neuron presynaptically inhibits the modulatory neuron. Activation of the extrinsic modulatory neuron elicits stable network oscillations in which the L and H neurons are active in alternation. The oscillations arise because the graded reciprocal synapses create the equivalent of a negative-slope conductance region in the I-V curves for the cells. Geometrical methods are used to analyze the properties of and the mechanism underlying these network oscillations.
Figures
Fig. 1.
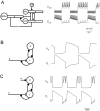
Simplifying a compartmental model of the MCN1-elicited gastric mill rhythm. A, Schematic representation showing the compartmental model (left) and voltage traces of the model Int1 and the LG neuron when the model MCN1 is stimulated at 15 Hz. [Adapted from Nadim et al. (1998).])B, The circuit in A is simplified to a pair of passive neurons L and H connected via graded reciprocal inhibition. L has a low resting potential and H has a high resting potential. L receives a slow modulatory excitation_s_ that is presynaptically gated by L. Also shown are the voltage traces of L and H. C, Same circuit as in_B_, but with an additional periodic inhibition P (representing the AB neuron in A) to H.
Fig. 2.
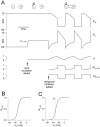
Slow modulatory excitation can balance an asymmetric half-center to produce oscillations. A, The_top two traces_ are the voltages of the two cells_H_ and L. Also shown are the slow modulatory excitation s to L, the activation of the L to H inhibition m_L→H, and the activation of the H to L inhibition m_H→L. These_traces start on the left with the two cells isolated, and s is held at 0. At the time indicated by the first arrow, s is activated. At the time indicated by the second arrow, the reciprocal inhibitory synapses are activated. Shown in the_V_L trace is the threshold voltage_V_T for presynaptic inhibition of_s by L. B, The synaptic transfer function for the H to L inhibition. C, The synaptic transfer function for the L to H inhibition. The vertical dotted line shows the threshold voltage _V_Tfor presynaptic inhibition of s by L.
Fig. 3.
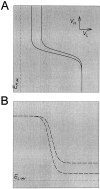
Reciprocal graded inhibition produces a region of negative slope conductance in the I–V curves. To obtain steady-state I–V curves, s was treated as a parameter. The I–V curves of L(solid line) and H (dashed line) are shown for three values of s (0, 0.5, and 1) in the absence (A) and presence (B) of the reciprocal inhibitory synapses. The resting potentials of L (marked by ▵) and H (marked by ▿) are shown in A.
Fig. 4.
Graded inhibition produces sigmoidal nullclines in the _V_L_–V_H phase plane. To plot the L nullcline (_N_L) and the H nullcline (_N_H) in the_V_L_–V_H phase plane, s was treated as a parameter._N_L (solid line) and_N_H (dashed line) are shown for three values of s (0, 0.5, and 1) in the absence (A) and presence (B) of the reciprocal inhibitory synapses. The resting potentials of L (marked by ▵) and H (marked by ▿) are shown in A. The intersections of N_L and_N_H are steady states, and the_arrows indicate the vector fields in the vicinity of these steady states. The direction of the vector field indicates whether the steady state is stable (○) or unstable (▪).
Fig. 5.
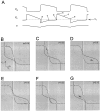
Analysis of one cycle of the oscillation using phase planes. A, Top, middle, and_bottom traces_ show the voltage traces of H and L and the modulatory excitation s. The dotted line_superimposed on the voltage trace of L is the threshold_V_T for presynaptic inhibition of the excitatory input. B–G show the_V_L_–V_H phase plane at the six representative times marked in A. The corresponding values of s are marked in each panel. The intersection of the L nullcline (solid line) and H nullcline (dashed line) is the quasi-steady state (○) for the indicated value of s. In each panel, the_arrow pointing toward the quasi-steady state of the next representative time ( ) indicates the movement of the phase point along the trajectory (dotted line; same in B–G).Vertical white line indicates the threshold_V_T.
Fig. 6.
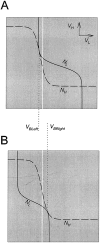
The L nullcline (solid line) and H nullcline (dashed line) are tangent at two distinct values of _V_L. A, The tangency on the top left branch of the H nullcline defines the saddle-node bifurcation point that corresponds to the onset of the L burst. B, The tangency on the bottom right branch of the H nullcline defines the saddle-node bifurcation point that corresponds to the termination of the L burst. A necessary condition for oscillations is that the threshold_V_T (white line) for presynaptic inhibition lies strictly between the_V_L values (_V_BLeftand _V_BRight) at these two tangency points.
Fig. 7.
Oscillations are disrupted when the activation curve of one of the reciprocal inhibitory synapses is too steep.A, Voltage traces show the alternation of activity in L and H. At the time indicated by the vertical arrow, the H to L synapse is made all-or-none by changing its activation curve to a step function. The dotted line denotes the threshold_V_T for presynaptic inhibition.B–D show the phase planes at the three times marked in_A_. Solid and _dashed curves_are the L and H nullclines. The _vertical white line_indicates the threshold _V_T.
Fig. 8.
Oscillations are disrupted when the activation curve of one of the reciprocal inhibitory synapses is too shallow.A, Voltage traces show the alternation of activity in L and H. At the time indicated by the first vertical arrow, the activation curve of the H to L synapse is made fivefold shallower. At the time indicated by the second vertical arrow, the activation curve of the H to L synapse is made less steep by a factor of two. B–D show the phase planes at the three times marked in A. Solid and_dashed curves_ are the L and H nullclines. The_vertical white line_ indicates the threshold_V_T.
Fig. 9.
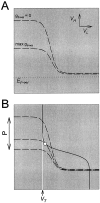
The effect of strength of the reciprocally inhibitory synapses on the nullclines. A, Increasing the strength of the H to L synapse pulls the _top left branch_of the L nullcline (solid line) toward the reversal potential (dotted line) of the H to L synapse.B, Increasing the strength of the L to H synapse pulls the bottom right branch of the H nullcline (dashed line) toward the reversal potential (dotted line) of the L to H synapse.
Fig. 10.
The effect of fast periodic inhibition to H on the nullclines. A, The H nullcline (dashed line) is shown in the absence of the inhibition (P) and in the presence of maximal inhibition. This inhibition pulls the top left branch of the H nullcline toward the reversal potential (dotted line) of the P to H synapse. B, The periodic inhibition of H by P swings the H nullcline back and forth between the two limits shown in_A_. The L nullcline is not affected. At some intermediate value of the P input, the two nullclines become tangent, producing a saddle-node bifurcation point (○). The vertical white line indicates the threshold _V_T for presynaptic inhibition of s by L.
Fig. 11.
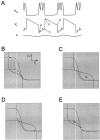
Analysis of one cycle of the oscillation in the presence of the periodic P input. A, Top, middle, and bottom traces show the voltage traces of H and L and the modulatory excitation s.B–E show the_V_L_–V_H phase plane at the four representative times marked in A. In each panel, the two dashed curves show the H nullcline when the periodic input P is at zero and at its maximum. The_solid line_ is the L nullcline, and ○ denotes the position of the phase point at that time. In each panel, the_arrow_ indicates the movement of the phase point along the trajectory (shown by the dotted line up to the next representative time). The vertical white line indicates the threshold _V_T for presynaptic inhibition of s by L.
Fig. 12.
Schematic drawing showing circuit configurations that can be driven to produce half-center oscillations from asymmetric neurons. The basic circuit consists of two neurons that in the absence of extrinsic input (A–C, left column) are quiescent (L) and tonically active (H). A, Circuit with a single inhibitory synapse from L to H. An excitatory input to L that is either periodic (white ∼︀) or presynaptically gated by L (gray ∼︀) produces antiphase oscillations.B, Circuit with a single inhibitory synapse from H to L. An inhibitory input to H that is either periodic (_white_∼︀) or presynaptically gated by H (gray ∼︀) produces antiphase oscillations. C, Circuit with reciprocally inhibitory synapse between L and H. An excitatory input to L that is presynaptically gated by L and a periodic inhibitory input to H work synergistically to produce antiphase oscillations.
Similar articles
- A switch between two modes of synaptic transmission mediated by presynaptic inhibition.
Coleman MJ, Meyrand P, Nusbaum MP. Coleman MJ, et al. Nature. 1995 Nov 30;378(6556):502-5. doi: 10.1038/378502a0. Nature. 1995. PMID: 7477408 - Recruitment of a projection neuron determines gastric mill motor pattern selection in the stomatogastric nervous system of the crab, Cancer borealis.
Norris BJ, Coleman MJ, Nusbaum MP. Norris BJ, et al. J Neurophysiol. 1994 Oct;72(4):1451-63. doi: 10.1152/jn.1994.72.4.1451. J Neurophysiol. 1994. PMID: 7823079 - Intercircuit control of motor pattern modulation by presynaptic inhibition.
Bartos M, Nusbaum MP. Bartos M, et al. J Neurosci. 1997 Apr 1;17(7):2247-56. doi: 10.1523/JNEUROSCI.17-07-02247.1997. J Neurosci. 1997. PMID: 9065486 Free PMC article. - Frequency control of a slow oscillatory network by a fast rhythmic input: pyloric to gastric mill interactions in the crab stomatogastric nervous system.
Marder E, Manor Y, Nadim F, Bartos M, Nusbaum MP. Marder E, et al. Ann N Y Acad Sci. 1998 Nov 16;860:226-38. doi: 10.1111/j.1749-6632.1998.tb09052.x. Ann N Y Acad Sci. 1998. PMID: 9928315 Review. - Oscillations and oscillatory behavior in small neural circuits.
Selverston AI, Ayers J. Selverston AI, et al. Biol Cybern. 2006 Dec;95(6):537-54. doi: 10.1007/s00422-006-0125-1. Epub 2006 Dec 7. Biol Cybern. 2006. PMID: 17151878 Review.
Cited by
- When complex neuronal structures may not matter.
Otopalik AG, Sutton AC, Banghart M, Marder E. Otopalik AG, et al. Elife. 2017 Feb 6;6:e23508. doi: 10.7554/eLife.23508. Elife. 2017. PMID: 28165322 Free PMC article. - Membrane potential resonance in non-oscillatory neurons interacts with synaptic connectivity to produce network oscillations.
Bel A, Rotstein HG. Bel A, et al. J Comput Neurosci. 2019 Apr;46(2):169-195. doi: 10.1007/s10827-019-00710-y. Epub 2019 Mar 20. J Comput Neurosci. 2019. PMID: 30895410 - The effects of varying the timing of inputs on a neural oscillator.
Ambrosio-Mouser C, Nadim F, Bose A. Ambrosio-Mouser C, et al. SIAM J Appl Dyn Syst. 2006;5(1):108-139. doi: 10.1137/050625795. SIAM J Appl Dyn Syst. 2006. PMID: 21052553 Free PMC article. - Neuronal morphologies built for reliable physiology in a rhythmic motor circuit.
Otopalik AG, Pipkin J, Marder E. Otopalik AG, et al. Elife. 2019 Jan 18;8:e41728. doi: 10.7554/eLife.41728. Elife. 2019. PMID: 30657452 Free PMC article. - The role of electrical coupling in generating and modulating oscillations in a neuronal network.
Mouser C, Bose A, Nadim F. Mouser C, et al. Math Biosci. 2016 Aug;278:11-21. doi: 10.1016/j.mbs.2016.05.001. Epub 2016 May 14. Math Biosci. 2016. PMID: 27188714 Free PMC article.
References
- Calabrese RL. Oscillations in motor pattern-generating networks. Curr Opin Neurobiol. 1995;5:816–823. - PubMed
- Coleman MJ, Meyrand P, Nusbaum MP. A switch between two modes of synaptic transmission mediated by presynaptic inhibition. Nature. 1995;378:502–505. - PubMed
- Friesen WO. Reciprocal inhibition: a mechanism underlying oscillatory animal movements. Neurosci Biobehav. 1994;18:547–553. - PubMed
Publication types
MeSH terms
LinkOut - more resources
Full Text Sources
