Dynamics of a chemoattractant receptor in living neutrophils during chemotaxis - PubMed (original) (raw)
Dynamics of a chemoattractant receptor in living neutrophils during chemotaxis
G Servant et al. Mol Biol Cell. 1999 Apr.
Free PMC article
Abstract
Persistent directional movement of neutrophils in shallow chemotactic gradients raises the possibility that cells can increase their sensitivity to the chemotactic signal at the front, relative to the back. Redistribution of chemoattractant receptors to the anterior pole of a polarized neutrophil could impose asymmetric sensitivity by increasing the relative strength of detected signals at the cell's leading edge. Previous experiments have produced contradictory observations with respect to receptor location in moving neutrophils. To visualize a chemoattractant receptor directly during chemotaxis, we expressed a green fluorescent protein (GFP)-tagged receptor for a complement component, C5a, in a leukemia cell line, PLB-985. Differentiated PLB-985 cells, like neutrophils, adhere, spread, and polarize in response to a uniform concentration of chemoattractant, and orient and crawl toward a micropipette containing chemoattractant. Recorded in living cells, fluorescence of the tagged receptor, C5aR-GFP, shows no apparent increase anywhere on the plasma membrane of polarized and moving cells, even at the leading edge. During chemotaxis, however, some cells do exhibit increased amounts of highly folded plasma membrane at the leading edge, as detected by a fluorescent probe for membrane lipids; this is accompanied by an apparent increase of C5aR-GFP fluorescence, which is directly proportional to the accumulation of plasma membrane. Thus neutrophils do not actively concentrate chemoattractant receptors at the leading edge during chemotaxis, although asymmetrical distribution of membrane may enrich receptor number, relative to adjacent cytoplasmic volume, at the anterior pole of some polarized cells. This enrichment could help to maintain persistent migration in a shallow gradient of chemoattractant.
Figures
Figure 1
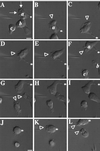
Responses of differentiated PLB-985 cells to a point source of chemoattractant. PLB-985 cells were differentiated by treatment with 1.3% DMSO for 7 d and plated on glass coverslips. Cells were then stimulated with fMLP (10 μM) delivered from a micropipette, and images were recorded every 5 s as described in MATERIALS AND METHODS. Panels A–I show morphological responses after (A) 30, (B) 90, (C) 150, (D) 210, (E) 240, (F) 270, (G) 300, and (H) 360 s of micropipette stimulation; panel I shows the same cells 90 s after removal of the micropipette. Panels J–L show responses of nonpolarized cells after (K) 30 and (L) 140 s exposure to fMLP in the micropipette. Arrows point to chemoattractant-stimulated membrane ruffles. Arrowheads point to newly formed or reorienting pseudopodia. Asterisks indicate stable points of reference in panels A–I and J–L, respectively, to allow the reader to appreciate movement of the micropipette. This session is representative of three similar observations. Bar, 10 μm. A video of the experiment described in this figure is available on the internet version of this paper, at http://www.molbiolcell.org.
Figure 2
Chemotactic behavior of PLB-985 cells stably expressing GFP introduced by a retroviral vector. Cells were infected, selected in G-418, and sorted by FACS for GFP fluorescence, as described in MATERIALS AND METHODS. GFP-expressing cells were differentiated in 1.3% DMSO for 7 d and plated on glass coverslips. Cells were then stimulated with fMLP (10 μM) delivered from a micropipette (white dot), and images were recorded every 5 s, under pseudoconfocal conditions, as described in MATERIALS AND METHODS. Panels A–F show responses after (A) 0, (B) 60, (C) 120, (D) 180, (E) 240, and (F) 300 s. Arrowheads point to pseudopodia advancing in response to the agonist. This session is representative of two similar observations. Bar, 10 μm. A video of the experiment described in this figure is available on the internet version of this paper, at http://www.molbiolcell.org.
Figure 3
Characterization of the C5aR-GFP chimera. (A) C5aR–GFP can mediate chemotaxis. HEK293 cells stably expressing either the C5aR or the C5aR–GFP fusion protein were subjected to a migration assay in a 48-well Boyden chamber, as described previously (Neptune and Bourne, 1997). At the end of the assay, cells adhering to the lower side of the porous filter were fixed, stained, and counted using a microscope. Results are expressed as the number of cells counted in a high-power field (HPF) (200×) and correspond to the mean ± SD of four determinations. Similar results were obtained in four other experiments. Absolute numbers of migrated cells in the experiment shown do not reflect different abilities of the two cell types to migrate toward C5a; instead, the absolute numbers reflect the numbers of each cell type used in each well (22,500 and 37,500 cells expressing the C5aR–GFP or the C5aR, respectively). (B) Integrity of the C5aR–GFP fusion protein in differentiated PLB-985 cells. PLB-985 cells were transduced with a retrovirus carrying C5aR–GFP as described in MATERIALS AND METHODS. Transduced cells were selected and GFP-positive cells were sorted by FACS. Cell extracts were prepared from 5 × 10⁶ differentiated cells as described in MATERIALS AND METHODS, resolved on 8% polyacrylamide, and transferred onto a polyvinylidene difluoride membrane. GFP and the C5aR–GFP were then revealed with a monoclonal GFP antibody. Lane 1, extract from 105 GFP-expressing cells; lanes 2 and 3, extracts from two different aliquots, each representing 3 × 10⁵ C5aR-GFP–expressing cells. (C) Binding of [125I]-C5a to PLB-985 cells. Differentiated GFP-expressing cells (squares) and C5aR-GFP–expressing cells (circles) were incubated at 4°C for 5 h with the indicated concentrations of [125I]-C5a (0.06–3.6 nM). Nonspecific binding was evaluated in the presence of 100 nM nonradioactive C5a. Incubations were terminated by rapid filtration though GF/C filters. In the experiment shown, nonlinear regression analysis of the binding data yielded Bmax values of 68,400 sites/cell and 47,600 sites/cell for C5aR–GFP and GFP-expressing PLB-985 cells, respectively. Similar results were obtained in two additional experiments.
Figure 4
C5aR–GFP dynamics after stimulation of PLB-985 cells with a uniform concentration of C5a. C5aR-GFP–expressing PLB-985 cells were differentiated with 1.3% DMSO, plated on glass coverslips, and exposed to a uniform concentration (20 nM) of C5a in mHBSS; images were recorded every 2 s, under pseudoconfocal conditions, as described in MATERIALS AND METHODS. Responses are shown after (A) 0, (B) 28, (C) 56, (D) 140, (E) 168, and (F) 308 s. Panels A′ and C′ show magnifications of the cells indicated in panels A and C, respectively. Panel F′ shows a magnification of panel F. Panel G shows a fluorescence intensity scan analysis of the cell in the lower left corner in panels F and F′. Arrows point to agonist-stimulated receptor patches. Arrowheads (in F and F′) point to internalized receptors located in the uropod of polarized cells. The asterisks in panel F indicate cells that spread but did not clearly develop a polarized morphology after stimulation. This session is representative of three similar observations. Bar, 10 μm. A video of the experiment described in this figure is available on the internet version of this paper, at http://www.molbiolcell.org.
Figure 5
C5aR-GFP dynamics after stimulation of PLB-985 cells with a point source of ChaCha delivered from a micropipette. C5aR-GFP-expressing cells were differentiated with 1.3% DMSO and plated on glass coverslips. Cells were then stimulated with ChaCha (100 μM) delivered from a micropipette, and images were recorded every 2 s, under pseudoconfocal conditions, as described in MATERIALS AND METHODS. Responses are shown after (A) 0, (B) 44, (C) 110, (D) 154, (E) 176, and (F) 220 s of micropipette stimulation (white dot). The closed arrowhead in panel A points to the retraction fibers of cell b. Open arrowheads (panel B) point to ruffles at the leading edges of locomoting cells. Arrows in panels C and E point at the back of polarized cells. Red arrowheads (panel F) point to internalized C5aR–GFP. This session is representative of three similar observations. Bar, 10 μm. A video of the experiment described in this figure is available on the internet version of this paper, at http://www.molbiolcell.org.
Figure 6
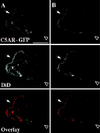
Localization of C5aR–GFP relative to the plasma membrane of moving PLB-985 cells. C5aR-GFP–expressing cells were differentiated with DMSO 1.3%, labeled with DiD, and plated on glass coverslips. Cells were then stimulated with ChaCha (100 μM) delivered from a micropipette. Under pseudoconfocal conditions, the GFP and DiD signals were alternatively recorded in the FITC and Texas Red channels, respectively, as described in MATERIALS AND METHODS. Single cells, from three different experiments, are shown crawling toward the source of ChaCha (white dot). Arrows point to the ruffling fronts of the cells. Bar, 10 μm.
Figure 7
Localization of C5aR–GFP relative to the plasma membrane of fixed PLB-985 cells. C5aR-GFP–expressing cells were differentiated with 1.3% DMSO, labeled with DiD, and plated on glass coverslips. Cells were then stimulated with a uniform concentration (20 nM) of C5a for 3 min at room temperature and fixed. The GFP and DiD signals were acquired alternatively in the FITC and Texas Red channels, respectively, as described in MATERIALS AND METHODS in successive 0.25-μm focal planes through the sample; out-of-focus light was removed with a constrained iterative deconvolution algorithm (Agard et al., 1989). (A) Maximum intensity projections of three-dimensional data stacks from a polarized DiD-stained, C5aR-GFP–expressing-cell. (B) A single focal plane of the cell in panel A. The arrow and arrowhead point to the front and the back of the cell, respectively. Bar, 10 μm.
Figure 8
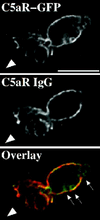
Immunostaining of cell-surface C5aRs. C5aR-GFP–expressing cells were differentiated with 1.3% DMSO and plated on glass-etched grid coverslips. Cells were stimulated with a point source of ChaCha (100 μM) delivered by a micropipette and fixed. Locations of cells responding to the micropipette were recorded, and immunofluorescence of surface C5aR was assessed as described in MATERIALS AND METHODS. The GFP and IgG signals were acquired alternatively in the FITC and Texas Red channels, respectively, as described in MATERIALS AND METHODS, in successive 0.25-μm focal planes through the sample; out-of-focus light wasremoved with a constrained iterative deconvolution algorithm (Agard et al., 1989). Images represent a single 0.25-μm focal plane near the bottom of the cell. The arrowhead indicates the direction of migration. Arrows point to internalized clusters of C5aR–GFP. These results were reproduced in one additional independent experiment. Bar, 10 μm.
Similar articles
- Polarization of chemoattractant receptor signaling during neutrophil chemotaxis.
Servant G, Weiner OD, Herzmark P, Balla T, Sedat JW, Bourne HR. Servant G, et al. Science. 2000 Feb 11;287(5455):1037-40. doi: 10.1126/science.287.5455.1037. Science. 2000. PMID: 10669415 Free PMC article. - Cross-desensitization of chemoattractant receptors occurs at multiple levels. Evidence for a role for inhibition of phospholipase C activity.
Richardson RM, Ali H, Tomhave ED, Haribabu B, Snyderman R. Richardson RM, et al. J Biol Chem. 1995 Nov 17;270(46):27829-33. doi: 10.1074/jbc.270.46.27829. J Biol Chem. 1995. PMID: 7499254 - Undifferentiated U937 cells transfected with chemoattractant receptors: a model system to investigate chemotactic mechanisms and receptor structure/function relationships.
Kew RR, Peng T, DiMartino SJ, Madhavan D, Weinman SJ, Cheng D, Prossnitz ER. Kew RR, et al. J Leukoc Biol. 1997 Mar;61(3):329-37. doi: 10.1002/jlb.61.3.329. J Leukoc Biol. 1997. PMID: 9060456 - Signaling by leukocyte chemoattractant and Fcgamma receptors in immune-complex tissue injury.
Alonso A, Bayón Y, Mateos JJ, Sánchez Crespo M. Alonso A, et al. Lab Invest. 1998 Apr;78(4):377-92. Lab Invest. 1998. PMID: 9564883 Review. No abstract available. - Neutrophil chemoattractant receptors and the membrane skeleton.
Klotz KN, Jesaitis AJ. Klotz KN, et al. Bioessays. 1994 Mar;16(3):193-8. doi: 10.1002/bies.950160310. Bioessays. 1994. PMID: 8166673 Review.
Cited by
- Analysis of barotactic and chemotactic guidance cues on directional decision-making of Dictyostelium discoideum cells in confined environments.
Belotti Y, McGloin D, Weijer CJ. Belotti Y, et al. Proc Natl Acad Sci U S A. 2020 Oct 13;117(41):25553-25559. doi: 10.1073/pnas.2000686117. Epub 2020 Sep 30. Proc Natl Acad Sci U S A. 2020. PMID: 32999070 Free PMC article. - TLR signaling paralyzes monocyte chemotaxis through synergized effects of p38 MAPK and global Rap-1 activation.
Yi L, Chandrasekaran P, Venkatesan S. Yi L, et al. PLoS One. 2012;7(2):e30404. doi: 10.1371/journal.pone.0030404. Epub 2012 Feb 9. PLoS One. 2012. PMID: 22347375 Free PMC article. - A comparison of mathematical models for polarization of single eukaryotic cells in response to guided cues.
Jilkine A, Edelstein-Keshet L. Jilkine A, et al. PLoS Comput Biol. 2011 Apr;7(4):e1001121. doi: 10.1371/journal.pcbi.1001121. Epub 2011 Apr 28. PLoS Comput Biol. 2011. PMID: 21552548 Free PMC article. Review. - KDM6A Loss Recruits Tumor-Associated Neutrophils and Promotes Neutrophil Extracellular Trap Formation in Pancreatic Cancer.
Yang J, Jin L, Kim HS, Tian F, Yi Z, Bedi K, Ljungman M, Pasca di Magliano M, Crawford H, Shi J. Yang J, et al. Cancer Res. 2022 Nov 15;82(22):4247-4260. doi: 10.1158/0008-5472.CAN-22-0968. Cancer Res. 2022. PMID: 36306422 Free PMC article. - Calpain regulates neutrophil chemotaxis.
Lokuta MA, Nuzzi PA, Huttenlocher A. Lokuta MA, et al. Proc Natl Acad Sci U S A. 2003 Apr 1;100(7):4006-11. doi: 10.1073/pnas.0636533100. Epub 2003 Mar 20. Proc Natl Acad Sci U S A. 2003. PMID: 12649322 Free PMC article.
References
- Agard DA, Hiraoka Y, Shaw P, Sedat JW. Fluorescence microscopy in three dimensions. Methods Cell Biol. 1989;30:353–377. - PubMed
- Baggiolini M. Chemokines and leukocyte traffic. Nature. 1998;392:565–568. - PubMed
- Barak LS, Ferguson SS, Zhang J, Caron MG. A β-arrestin/green fluorescent protein biosensor for detecting G protein-coupled receptor activation. J Biol Chem. 1997a;272:27497–27500. - PubMed
- Barak LS, Ferguson SS, Zhang J, Martenson C, Meyer T, Caron MG. Internal trafficking and surface mobility of a functionally intact β2-adrenergic receptor-green fluorescent protein conjugate. Mol Pharmacol. 1997b;51:177–184. - PubMed
- Berman DM, Gilman AG. Mammalian RGS proteins: barbarians at the gate. J Biol Chem. 1998;273:1269–1272. - PubMed
Publication types
MeSH terms
Substances
Grants and funding
- R37 GM027800/GM/NIGMS NIH HHS/United States
- GM-25101/GM/NIGMS NIH HHS/United States
- GM-27800/GM/NIGMS NIH HHS/United States
- R01 GM025101/GM/NIGMS NIH HHS/United States
- R01 GM027800/GM/NIGMS NIH HHS/United States
- CA-54427/CA/NCI NIH HHS/United States
LinkOut - more resources
Full Text Sources
Other Literature Sources
Miscellaneous


