Comparative genomic hybridization, loss of heterozygosity, and DNA sequence analysis of single cells - PubMed (original) (raw)
Comparative Study
Comparative genomic hybridization, loss of heterozygosity, and DNA sequence analysis of single cells
C A Klein et al. Proc Natl Acad Sci U S A. 1999.
Abstract
A PCR strategy is described for global amplification of DNA from a single eukaryotic cell that enables the comprehensive analysis of the whole genome. By comparative genomic hybridization, not only gross DNA copy number variations, such as monosomic X and trisomic 21 in single male cells and cells from Down's syndrome patients, respectively, but multiple deletions and amplifications characteristic for human tumor cells are reliably retrieved. As a model of heterogeneous cell populations exposed to selective pressure, we have studied single micrometastatic cells isolated from bone marrow of cancer patients. The observed congruent pattern of comparative genomic hybridization data, loss of heterozygosity, and mutations as detected by sequencing attests to the technique's fidelity and demonstrates its usefulness for assessing clonal evolution of genetic variants in complex populations.
Figures
Figure 1
Isolation of single fluorescent cells from bone marrow by micromanipulation and preparation of DNA after proteinase K (PK) treatment. After PK inactivation, the double-stranded DNA was digested with _Mse_I, leaving a TA overhang for adapter annealing and subsequent ligation. After primary amplification, 1/100 of the PCR products was reamplified in the presence of bio-UTP, and 2 μg were used for hybridization.
Figure 2
CGH profile of a single peripheral blood leukocyte of a male patient with Down’s syndrome. To be considered significant, deviations from the central line had to cross the green (chromosomal gain) or red (chromosomal loss) punctate line. The gray shaded horizontal bars indicate regions excluded from analysis because of the prevalence of heterochromatic DNA. The chromosome 21 (except of the blocked heterochromatic region) was found to be amplified entirely whereas all other chromosomes showed normal profiles.
Figure 3
Comparison of the CGH profiles of a “conventional” CGH experiment using 1 μg of nick-translated DNA prepared from the MCF-7 cell line and from four single cells of the same cell line after PCR amplification. Of all profiles, the results of chromosome 2 are shown. The green bar on the right side of the chromosome 2 symbol of single cell 1 indicates the partial chromosomal gain only detected in this cell but not in any other single cell or the pooled DNA of the cell line.
Figure 4
Two-color interphase-FISH on MCF-7 cells with YAC clones specific for 2p25 (red) and 2q31 (green). In one cell (upper left corner), three signals can be identified for the 2p region, but only two can be identified for 2q. The other cells show two signals for both the 2p and the 2q probes.
Figure 5
Isolation of a single disseminated tumor cell from bone marrow of a breast cancer patient. (A) Nucleated cell suspension containing one immunofluorescent cytokeratin-positive cell. (B) Exclusion of visible light, demonstrating the bright cytoplasmic staining and the negative background of surrounding cells. The fluorescent cell then was aspirated by a glass capillary (C) and was transferred to a fresh slide. No cells other than the fluorescent cell were transferred because the whole visual field did not contain any other cell. From there, the cell was taken to the amplification tube.
Figure 6
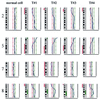
CGH profile of four single tumor cells (T#1–T#4) and one normal cell of a patient with CUP syndrome. Chromosomes 2, 5, 7, and 8 were chosen for comparison of identical and divergent findings. The losses on chromosomes 2, 5, and 8p were common for all tumor cells as was the gain of 8q whereas the loss of chromosome 7 was only seen for T#2. As in the other profiles, chromosomal losses are marked by red vertical bars at the left side of the chromosome symbol, and gains are marked by a green bar on the right side.
Figure 7
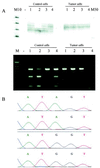
(A) LOH analysis using the dinucleotide repeat polymorphism at D5S346 locus linked to the APC gene (Upper) and PCR–restriction fragment length polymorphism of a Alw21I site within exon 15 of the APC gene (Lower). In the first experiment, all four tumor cells demonstrated loss of one allele whereas the single control cells contained two alleles, except for control cell 2. In the APC PCR–restriction fragment length polymorphism experiment, all but one control cell (3) had two alleles whereas the tumor cells only contained the uncut fragment. The fragment of tumor cell 4 was not amplified. −, negative control; M10, 10-bp ladder; M50, 50-bp ladder; M, marker for agarose gel electrophoresis. (B) Sequence of the mutation found in codon 215. The single control cells contained the wild-type sequence with an A at nucleotide 643 (upper two sequences) whereas the tumor cells were mutated at this position showing an A → G mutation (lower two sequences). The sequences of four of the eight cells are shown.
Similar articles
- Combined array-comparative genomic hybridization and single-nucleotide polymorphism-loss of heterozygosity analysis reveals complex genetic alterations in cervical cancer.
Kloth JN, Oosting J, van Wezel T, Szuhai K, Knijnenburg J, Gorter A, Kenter GG, Fleuren GJ, Jordanova ES. Kloth JN, et al. BMC Genomics. 2007 Feb 20;8:53. doi: 10.1186/1471-2164-8-53. BMC Genomics. 2007. PMID: 17311676 Free PMC article. - Retention of polysomy at 9p23-24 during karyotypic evolution in human breast cancer cell line COLO 824.
Savelyeva L, Claas A, An H, Weber RG, Lichter P, Schwab M. Savelyeva L, et al. Genes Chromosomes Cancer. 1999 Jan;24(1):87-93. Genes Chromosomes Cancer. 1999. PMID: 9892114 - High resolution analysis of DNA copy number variation using comparative genomic hybridization to microarrays.
Pinkel D, Segraves R, Sudar D, Clark S, Poole I, Kowbel D, Collins C, Kuo WL, Chen C, Zhai Y, Dairkee SH, Ljung BM, Gray JW, Albertson DG. Pinkel D, et al. Nat Genet. 1998 Oct;20(2):207-11. doi: 10.1038/2524. Nat Genet. 1998. PMID: 9771718 - Progress in concurrent analysis of loss of heterozygosity and comparative genomic hybridization utilizing high density single nucleotide polymorphism arrays.
Zhou X, Rao NP, Cole SW, Mok SC, Chen Z, Wong DT. Zhou X, et al. Cancer Genet Cytogenet. 2005 May;159(1):53-7. doi: 10.1016/j.cancergencyto.2004.09.014. Cancer Genet Cytogenet. 2005. PMID: 15860358 Review. - Use of single nucleotide polymorphism-based mapping arrays to detect copy number changes and loss of heterozygosity in multiple myeloma.
Walker BA, Morgan GJ. Walker BA, et al. Clin Lymphoma Myeloma. 2006 Nov;7(3):186-91. doi: 10.3816/CLM.2006.n.057. Clin Lymphoma Myeloma. 2006. PMID: 17229333 Review.
Cited by
- Mutational analysis of single circulating tumor cells by next generation sequencing in metastatic breast cancer.
De Luca F, Rotunno G, Salvianti F, Galardi F, Pestrin M, Gabellini S, Simi L, Mancini I, Vannucchi AM, Pazzagli M, Di Leo A, Pinzani P. De Luca F, et al. Oncotarget. 2016 May 3;7(18):26107-19. doi: 10.18632/oncotarget.8431. Oncotarget. 2016. PMID: 27034166 Free PMC article. - Human cancers express a mutator phenotype.
Bielas JH, Loeb KR, Rubin BP, True LD, Loeb LA. Bielas JH, et al. Proc Natl Acad Sci U S A. 2006 Nov 28;103(48):18238-42. doi: 10.1073/pnas.0607057103. Epub 2006 Nov 15. Proc Natl Acad Sci U S A. 2006. PMID: 17108085 Free PMC article. - The hematopoietic system-specific minor histocompatibility antigen HA-1 shows aberrant expression in epithelial cancer cells.
Klein CA, Wilke M, Pool J, Vermeulen C, Blokland E, Burghart E, Krostina S, Wendler N, Passlick B, Riethmüeller G, Goulmy E. Klein CA, et al. J Exp Med. 2002 Aug 5;196(3):359-68. doi: 10.1084/jem.20011838. J Exp Med. 2002. PMID: 12163564 Free PMC article. - Tumour heterogeneity and metastasis at single-cell resolution.
Lawson DA, Kessenbrock K, Davis RT, Pervolarakis N, Werb Z. Lawson DA, et al. Nat Cell Biol. 2018 Dec;20(12):1349-1360. doi: 10.1038/s41556-018-0236-7. Epub 2018 Nov 26. Nat Cell Biol. 2018. PMID: 30482943 Free PMC article. Review. - Reproducible and inexpensive probe preparation for oligonucleotide arrays.
Zhang Y, Price BD, Tetradis S, Chakrabarti S, Maulik G, Makrigiorgos GM. Zhang Y, et al. Nucleic Acids Res. 2001 Jul 1;29(13):E66-6. doi: 10.1093/nar/29.13.e66. Nucleic Acids Res. 2001. PMID: 11433042 Free PMC article.
References
- Telenius H, Carter N P, Bebb C E, Nordenskjold M, Ponder B A, Tunnacliffe A. Genomics. 1992;13:718–725. - PubMed
- Speicher M R, du Manoir S, Schrock E, Holtgreve Grez H, Schoell B, Lengauer C, Cremer T, Ried T. Hum Mol Genet. 1993;2:1907–1914. - PubMed
- Kuukasjarvi T, Tanner M, Pennanen S, Karhu R, Visakorpi T, Isola J. Genes Chromosomes Cancer. 1997;18:94–101. - PubMed
Publication types
MeSH terms
Substances
LinkOut - more resources
Full Text Sources
Other Literature Sources
Research Materials


