Neuroanatomical correlates of hunger and satiation in humans using positron emission tomography - PubMed (original) (raw)
Neuroanatomical correlates of hunger and satiation in humans using positron emission tomography
P A Tataranni et al. Proc Natl Acad Sci U S A. 1999.
Abstract
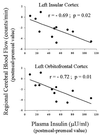
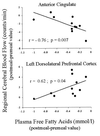
The central role of the hypothalamus in the origination and/or processing of feeding-related stimuli may be modulated by the activity of other functional areas of the brain including the insular cortex (involved in enteroceptive monitoring) and the prefrontal cortex (involved in the inhibition of inappropriate response tendencies). Regional cerebral blood flow (rCBF), a marker of neuronal activity, was measured in 11 healthy, normal-weight men by using positron emission tomography in a state of hunger (after 36-h fast) and a state of satiation (after a liquid meal). Hunger was associated with significantly increased rCBF in the vicinity of the hypothalamus and insular cortex and in additional paralimbic and limbic areas (orbitofrontal cortex, anterior cingulate cortex, and parahippocampal and hippocampal formation), thalamus, caudate, precuneus, putamen, and cerebellum. Satiation was associated with increased rCBF in the vicinity of the ventromedial prefrontal cortex, dorsolateral prefrontal cortex, and inferior parietal lobule. Changes in plasma insulin concentrations in response to the meal were negatively correlated with changes in rCBF in the insular and orbitofrontal cortex. Changes in plasma free fatty acid concentrations in response to the meal were negatively correlated with changes in rCBF in the anterior cingulate and positively correlated with changes in rCBF in the dorsolateral prefrontal cortex. In conclusion, these findings raise the possibility that several regions of the brain participate in the regulation of hunger and satiation and that insulin and free fatty acids may be metabolic modulators of postprandial brain neuronal events. Although exploratory, the present study provides a foundation for investigating the human brain regions and cognitive operations that respond to nutritional stimuli.
Figures
Figure 1
Images of brain activation in response to hunger and satiation. Brain regions with significant increase in rCBF in response to hunger are shown in blue; brain regions with significant increase in rCBF in response to satiation are shown in yellow. Images were generated by using PET and MRI data from 11 healthy, lean individuals. Color-coded images are superimposed onto an average of the subjects’ brain MRIs (grayscale image). Horizontal brain sections correspond to the coordinates of the Talairach and Tournoux brain atlas (27). The number under each section reflects the distance in mm superior (+) or inferior (−) to a horizontal plane between the anterior and posterior commissures. The right hemisphere in each section is on the reader’s right. Compared with satiation, hunger was associated with significantly increased rCBF (P < 0.005 uncorrected for multiple comparisons) in the hypothalamus (hy), thalamus (th), anterior cingulate (ac), insula/claustrum (in), orbitofrontal and temporal cortex (of/at), hippocampus/parahippocampul gyrus (hi/pa), precuneus (pcu), caudate/ventricle (ca/v), putamen (pu), and cerebellum (ce). Compared with hunger, satiation was associated with increased rCBF (P < 0.005 uncorrected for multiple comparisons) in the ventromedial prefrontal cortex (vmpf), dorsolateral prefrontal cortex (dlpf), ventrolateral prefrontal cortex (alpf), and inferior parietal lobule (ipa). The location and magnitude of maximal difference are shown in Tables 2 and 3.
Figure 2
Correlations between changes in plasma insulin concentrations elicited by satiation and changes in normalized PET counts in the left insular cortex centered around Talairach atlas coordinates (x = −40, y = 12, z = 5; Upper) and left orbitofrontal cortex centered around Talairach atlas coordinates (x = −28, y = 16, z = −12; Lower).
Figure 3
Correlations between changes in plasma free fatty acids concentrations elicited by satiation and changes in normalized PET counts in the anterior cingulate centered around Talairach atlas coordinates (x = 0, y = 25, z = 18; Upper) and left dorsolateral prefrontal cortex centered around Talairach atlas coordinates (x = −52, y = 32, z = 22; Lower).
Similar articles
- Sex differences in the human brain's response to hunger and satiation.
Del Parigi A, Chen K, Gautier JF, Salbe AD, Pratley RE, Ravussin E, Reiman EM, Tataranni PA. Del Parigi A, et al. Am J Clin Nutr. 2002 Jun;75(6):1017-22. doi: 10.1093/ajcn/75.6.1017. Am J Clin Nutr. 2002. PMID: 12036808 - Differential brain responses to satiation in obese and lean men.
Gautier JF, Chen K, Salbe AD, Bandy D, Pratley RE, Heiman M, Ravussin E, Reiman EM, Tataranni PA. Gautier JF, et al. Diabetes. 2000 May;49(5):838-46. doi: 10.2337/diabetes.49.5.838. Diabetes. 2000. PMID: 10905495 - Effect of satiation on brain activity in obese and lean women.
Gautier JF, Del Parigi A, Chen K, Salbe AD, Bandy D, Pratley RE, Ravussin E, Reiman EM, Tataranni PA. Gautier JF, et al. Obes Res. 2001 Nov;9(11):676-84. doi: 10.1038/oby.2001.92. Obes Res. 2001. PMID: 11707534 - Neuroimaging and obesity: mapping the brain responses to hunger and satiation in humans using positron emission tomography.
Del Parigi A, Gautier JF, Chen K, Salbe AD, Ravussin E, Reiman E, Tataranni PA. Del Parigi A, et al. Ann N Y Acad Sci. 2002 Jun;967:389-97. Ann N Y Acad Sci. 2002. PMID: 12079866 Review. - Regional cerebral blood flow in depression measured by positron emission tomography: the relationship with clinical dimensions.
Bench CJ, Friston KJ, Brown RG, Frackowiak RS, Dolan RJ. Bench CJ, et al. Psychol Med. 1993 Aug;23(3):579-90. doi: 10.1017/s0033291700025368. Psychol Med. 1993. PMID: 7901863 Review.
Cited by
- Prior Consumption of a Fat Meal in Healthy Adults Modulates the Brain's Response to Fat.
Eldeghaidy S, Marciani L, Hort J, Hollowood T, Singh G, Bush D, Foster T, Taylor AJ, Busch J, Spiller RC, Gowland PA, Francis ST. Eldeghaidy S, et al. J Nutr. 2016 Nov;146(11):2187-2198. doi: 10.3945/jn.116.234104. Epub 2016 Sep 21. J Nutr. 2016. PMID: 27655761 Free PMC article. Clinical Trial. - An official American Thoracic Society statement: update on the mechanisms, assessment, and management of dyspnea.
Parshall MB, Schwartzstein RM, Adams L, Banzett RB, Manning HL, Bourbeau J, Calverley PM, Gift AG, Harver A, Lareau SC, Mahler DA, Meek PM, O'Donnell DE; American Thoracic Society Committee on Dyspnea. Parshall MB, et al. Am J Respir Crit Care Med. 2012 Feb 15;185(4):435-52. doi: 10.1164/rccm.201111-2042ST. Am J Respir Crit Care Med. 2012. PMID: 22336677 Free PMC article. - Making claims: functional foods for managing appetite and weight.
Blundell J. Blundell J. Nat Rev Endocrinol. 2010 Jan;6(1):53-6. doi: 10.1038/nrendo.2009.224. Nat Rev Endocrinol. 2010. PMID: 20010971 - CTRP14 inactivation alters physical activity and food intake response to fasting and refeeding.
Sarver DC, Xu C, Aja S, Wong GW. Sarver DC, et al. Am J Physiol Endocrinol Metab. 2022 Jun 1;322(6):E480-E493. doi: 10.1152/ajpendo.00002.2022. Epub 2022 Apr 11. Am J Physiol Endocrinol Metab. 2022. PMID: 35403439 Free PMC article. - Neuroimaging evidence implicating cerebellum in support of sensory/cognitive processes associated with thirst.
Parsons LM, Denton D, Egan G, McKinley M, Shade R, Lancaster J, Fox PT. Parsons LM, et al. Proc Natl Acad Sci U S A. 2000 Feb 29;97(5):2332-6. doi: 10.1073/pnas.040555497. Proc Natl Acad Sci U S A. 2000. PMID: 10688891 Free PMC article.
References
- Levin B E, Routh V H. Am J Physiol. 1996;271:R491–R500. - PubMed
- Oomura Y. In: Handbook of the Hypothalamus: Physiology of the Hypothalamus. Morgane P J, Panksepp J, editors. New York: Dekker; 1981. pp. 557–620.
- Kuenzel W J. J Nutr. 1994;124:1355S–1370S. - PubMed
- Stellar E. Psychol Rev. 1954;61:5–22. - PubMed
MeSH terms
Substances
LinkOut - more resources
Full Text Sources
Other Literature Sources


