Reduced intracellular ionic strength as the initial trigger for activation of endothelial volume-regulated anion channels - PubMed (original) (raw)
Reduced intracellular ionic strength as the initial trigger for activation of endothelial volume-regulated anion channels
T Voets et al. Proc Natl Acad Sci U S A. 1999.
Abstract
Most mammalian cell types, including endothelial cells, respond to cell swelling by activating a Cl- current termed ICl,swell, but it is not known how the physical stimulus of cell swelling is transferred to the channels underlying ICl,swell. We have investigated the precise relation between cell volume and ICl,swell in endothelial cells by performing whole-cell current recordings while continuously monitoring cell thickness (Tc) as a measure for cell volume. The time course of Tc was accurately predicted by a theoretical model that describes volume changes of patch-clamped cells in response to changes in the extracellular osmolality (OSMo). This model also predicts significant changes in intracellular ionic strength (Gammai) when OSMo is altered. Under all experimental conditions ICl,swell closely followed the changes in Gammai, whereas ICl,swell and cell volume were often found to change independently. These results do not support the hypothesis that Gammai regulates the volume set point for activation of ICl,swell. Instead, they are in complete agreement with a model in which a decrease of Gammai rather than an increase in cell volume is the initial trigger for activation of ICl,swell.
Figures
Figure 1
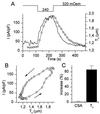
Dimensions of CPAE cells. (A) Histogram of _T_c values of nondialyzed CPAE cells in isotonic solution. Pooled data from 101 _T_c determinations on 76 cells. (B) Correlation between CSA and _C_m for eight whole-cell patch-clamped cells. The broken line represents the best linear fit, with a slope of 17.6 μm2/pF (r = 0.996). Note that these cells cover the whole range of CSA and _C_m values observed in this study.
Figure 2
Simultaneous measurement of _T_c and whole-cell currents. (A) Changes in _T_c (solid line) and whole-cell currents (circles) induced by the indicated changes in OSMo. The whole-cell current was identified as _I_Cl,swell. (B) Correlation between _T_c and _I_Cl,swell during the experiment shown in A. (C) Average increase in CSA and _T_c in dialyzed cells (n = 8) after 200 s in hypotonic solution (240 mOsm).
Figure 3
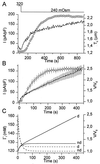
Changes in _T_c and _I_Cl,swell during a prolonged reduction of OSMo. (A) Changes in _T_c (solid line) and _I_Cl,swell (circles) as OSMo was lowered from 320 to 240 mOsm. (B) Average current density (circles) and relative volume V/_V_0 (solid line) during a 450-s reduction of OSM0 from 320 to 240 mOsm (n = 10). The broken line in A and B represents the best fit of the model. In this panel, time 0 corresponds to the time at which OSMo was reduced. (C) Model prediction of V/_V_0 (solid lines) and Γi (broken lines) for dialyzed (d) and nondialyzed (nd) cells.
Figure 4
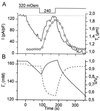
Comparison of experimental data of _T_c and _I_Cl,swell with model predictions of V/_V_0 and Γi during stepwise changes in OSMo. (A) _T_c (solid line) and _I_Cl,swell (circles) as OSMo is stepped first to 240 mOsm and thereafter to 200 mOsm. (B) Model prediction of cell volume (solid line) and Γi (broken line) for the experiment shown in A. (C) _T_c (solid line) and _I_Cl,swell (circles) as OSMo is stepped first to 200 mOsm and thereafter to 240 mOsm. (D) Same as B for the experiment shown in C.
Figure 5
_T_c and _I_Cl,swell in cells dialyzed with pipette solutions with altered osmolality and/or salt content. (A) Activation of _I_Cl,swell (circles) without any increase in _T_c (solid line) in a cell dialyzed with a low-salt pipette solution (Γp = 125 mM; 290 mOsm), further activation of _I_Cl,swell by reducing OSMo to 240 mOsm and inactivation of _I_Cl,swell by increasing OSMo to 400 mOsm. (B) Model prediction of V/_V_0 (solid line) and Γi (broken line) for the experiment shown in A. (C) Increase in _T_c (solid line) without significant activation of _I_Cl,swell (circles) in a cell dialyzed with a high-salt pipette solution (Γp = 195 mM; 365 mOsm). Reducing OSMo to 240 mOsm causes further cell swelling and activation of _I_Cl,swell. (D) Same as B for the experiment shown in C. (E) Increase in _T_c (solid line) and activation of _I_Cl,swell (circles) in a cell dialyzed with a hypertonic pipette solution with normal salt content (Γp = 155 mM; 365 mOsm). (F) Same as B for the experiment shown in E.
Figure 6
Application of negative pressure to the patch pipette does not affect activation of _I_Cl,swell. (A) After break-in (time 0), a constant negative pressure was applied on the patch pipette, causing extensive shrinkage of the cell. Reducing OSMo to 240 mOsm causes an increase of _T_c (solid line) to levels that remain below the resting _T_c (indicated by the broken line). Neither activation nor deactivation of _I_Cl,swell (circles) is affected by the negative pressure. (B) Model prediction of V/_V_o (solid line) and Γi (broken line) for the experiment shown in A.
Similar articles
- Regulation of a swelling-activated chloride current in bovine endothelium by protein tyrosine phosphorylation and G proteins.
Voets T, Manolopoulos V, Eggermont J, Ellory C, Droogmans G, Nilius B. Voets T, et al. J Physiol. 1998 Jan 15;506 ( Pt 2)(Pt 2):341-52. doi: 10.1111/j.1469-7793.1998.341bw.x. J Physiol. 1998. PMID: 9490863 Free PMC article. - Swelling-activated chloride current is persistently activated in ventricular myocytes from dogs with tachycardia-induced congestive heart failure.
Clemo HF, Stambler BS, Baumgarten CM. Clemo HF, et al. Circ Res. 1999 Feb 5;84(2):157-65. doi: 10.1161/01.res.84.2.157. Circ Res. 1999. PMID: 9933247 - Activation of volume-regulated chloride currents by reduction of intracellular ionic strength in bovine endothelial cells.
Nilius B, Prenen J, Voets T, Eggermont J, Droogmans G. Nilius B, et al. J Physiol. 1998 Jan 15;506 ( Pt 2)(Pt 2):353-61. doi: 10.1111/j.1469-7793.1998.353bw.x. J Physiol. 1998. PMID: 9490864 Free PMC article. - Volume-regulated Cl- current: contributions of distinct Cl- channels and localized Ca2+ signals.
Liu Y, Zhang H, Men H, Du Y, Xiao Z, Zhang F, Huang D, Du X, Gamper N, Zhang H. Liu Y, et al. Am J Physiol Cell Physiol. 2019 Sep 1;317(3):C466-C480. doi: 10.1152/ajpcell.00507.2018. Epub 2019 Jun 26. Am J Physiol Cell Physiol. 2019. PMID: 31242393 - Swelling- and Stretch-activated Chloride Channels in the Heart: Regulation and Function.
Baumgarten CM, Browe DM, Ren Z. Baumgarten CM, et al. In: Kamkin A, Kiseleva I, editors. Mechanosensitivity in Cells and Tissues. Moscow: Academia; 2005. In: Kamkin A, Kiseleva I, editors. Mechanosensitivity in Cells and Tissues. Moscow: Academia; 2005. PMID: 21290764 Free Books & Documents. Review.
Cited by
- Hypoxia, Ion Channels and Glioblastoma Malignancy.
Michelucci A, Sforna L, Franciolini F, Catacuzzeno L. Michelucci A, et al. Biomolecules. 2023 Dec 4;13(12):1742. doi: 10.3390/biom13121742. Biomolecules. 2023. PMID: 38136613 Free PMC article. Review. - Structural insights into anion selectivity and activation mechanism of LRRC8 volume-regulated anion channels.
Liu H, Polovitskaya MM, Yang L, Li M, Li H, Han Z, Wu J, Zhang Q, Jentsch TJ, Liao J. Liu H, et al. Cell Rep. 2023 Aug 29;42(8):112926. doi: 10.1016/j.celrep.2023.112926. Epub 2023 Aug 6. Cell Rep. 2023. PMID: 37543949 Free PMC article. - Physiological Functions of the Volume-Regulated Anion Channel VRAC/LRRC8 and the Proton-Activated Chloride Channel ASOR/TMEM206.
Kostritskaia Y, Klüssendorf M, Pan YE, Hassani Nia F, Kostova S, Stauber T. Kostritskaia Y, et al. Handb Exp Pharmacol. 2024;283:181-218. doi: 10.1007/164_2023_673. Handb Exp Pharmacol. 2024. PMID: 37468723 - Structure of a volume-regulated heteromeric LRRC8A/C channel.
Rutz S, Deneka D, Dittmann A, Sawicka M, Dutzler R. Rutz S, et al. Nat Struct Mol Biol. 2023 Jan;30(1):52-61. doi: 10.1038/s41594-022-00899-0. Epub 2022 Dec 15. Nat Struct Mol Biol. 2023. PMID: 36522427 Free PMC article.
References
- McManus M L, Churchwell K B, Strange K. N Engl J Med. 1995;333:1260–1266. - PubMed
- Okada Y. Am J Physiol. 1997;273:C755–C789. - PubMed
- Nilius B, Eggermont J, Voets T, Buyse G, Manolopoulos V, Droogmans G. Prog Biophys Mol Biol. 1997;68:69–119. - PubMed
- Strange K, Emma F, Jackson P S. Am J Physiol. 1996;270:C711–C730. - PubMed
- Emma F, McManus M, Strange K. Am J Physiol. 1997;272:C1766–C1775. - PubMed
Publication types
MeSH terms
Substances
LinkOut - more resources
Full Text Sources
Other Literature Sources


