Both transcriptional and posttranscriptional mechanisms regulate human telomerase template RNA levels - PubMed (original) (raw)
Comparative Study
Both transcriptional and posttranscriptional mechanisms regulate human telomerase template RNA levels
X Yi et al. Mol Cell Biol. 1999 Jun.
Abstract
The human telomerase RNA component (hTR) is present in normal somatic cells at lower levels than in cancer-derived cell lines. To understand the mechanisms regulating hTR levels in different cell types, we have compared the steady-state hTR levels in three groups of cells: (i) normal telomerase-negative human diploid cells; (ii) normal cells transfected with the human telomerase catalytic subunit, hTERT; and (iii) cells immortalized in vitro and cancer cells expressing their own endogenous hTERT. To account for the differences in steady-state hTR levels observed in these cell types, we compared the transcription rate and half-life of hTR in a subset of these cells. The half-life of hTR in telomerase-negative cells is about 5 days and is increased 1.6-fold in the presence of hTERT. The transcription rate of hTR is essentially unchanged in cells expressing exogenous hTERT, and the increased steady-state hTR level appears to be due to the increased half-life. However, the transcription rate of hTR is greatly increased in cells expressing endogenous hTERT, suggesting some overlap in transcriptional regulatory control. We conclude that the higher hTR level in cells expressing an endogenous telomerase can be a result of both increased transcription and a longer half-life and that the longer half-life might be partially a result of protection or stabilization by the telomerase catalytic subunit. The 4-week half-life of hTR in H1299 tumor cells is the longest half-life yet reported for any RNA.
Figures
FIG. 1
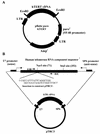
(A) Diagram of the construction of pBabe puro hTERT. An _Eco_RI fragment from pGRN145, containing the consensus Kozak sequence and the full-length human telomerase catalytic subunit cDNA, was cloned in the _Eco_RI site of the pBabe puro retroviral construct to form pBabe puro hTERT. (B) Diagram of plasmid construction for the generation of competitor RNA for quantitative RT-PCR (pTRC3+). The original plasmid pTRC3 is pGEM-5zf(+) with hTR cDNA cloned in its _Sac_I site, and the orientation is such that the T7 transcript of this construct is the sense strand. The _Nar_I and _Stu_I sites shown are unique sites in this plasmid. The location of the PCR primers used for RT-PCR assays in this study (F3B and R3C [Table 1]) are shown. A 20-bp fragment was inserted into pTRC3 by ligating the annealed oligonucleotides with pTRC3 linearized with _Nar_I. The oligonucleotides contained an equal number of G · C and A · T base pairs, so that the insertion did not change the G+C content of the PCR product compared to the RT-PCR product of hTR. The resulting plasmid, pTRC3+, was linearized with _Stu_I, and competitor RNA was generated with the T7 MAXIscript in vitro transcription kit.
FIG. 2
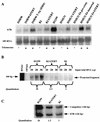
Relative quantitation of steady-state hTR levels by Northern hybridization, RNase protection assay, and quantitative RT-PCR. (A) Northern hybridization of hTR and 18S rRNA. The intensities of the hTR and 18S hybridization bands were quantitated, and the intensities of the 18S bands were used as a loading control to normalize the hTR hybridization bands. (B) Comparison of steady-state hTR levels in H1299, BJ, and BJ hTERT cells by the RNase protection assay. The intensity of the protected band in each assay was plotted against the amount of input total RNA for each cell type, and the average intensity per 10 μg of input total RNA was calculated by linear regression based on individual graphs. (C) Comparison of steady-state hTR levels in H1299, BJ, and BJ hTERT cells by quantitative RT-PCR. The number of hTR molecules in 2 μg of total RNA from H1299, BJ, or BJ hTERT cells was calculated by measuring the amount of added competitor RNA and the ratio of intensities of the bands corresponding to competitor RNA and hTR.
FIG. 3
Transcription runoff analysis of hTR. Transcription runoff assays were performed with nuclei isolated from BJ, BJ hTERT, H1299, IMR90, and IMR90 T-Ag cells. Runoff transcripts were hybridized to a nylon membrane bearing the target DNA plasmids indicated. Shown is one set of slot blots that were done in triplicate for each cell type, from one of the nuclear runoff assays. Because BJ hTERT and IMR90 T-Ag contain stably integrated plasmid DNA, nuclear runoff transcripts from these cells also hybridized to pGEM-5zf(+) and pBluescript SK(+) on the membrane. After correction for the background hybridization of vector-only plasmids, the transcription rates of hTR were normalized to the human β-actin signal (see Materials and Methods) and expressed relative to the rate obtained in BJ fibroblasts (Table 3).
FIG. 4
Half-life of hTR as determined by 4-thiouridine labeling and quantitative RT-PCR. The cells were labeled with 4-thiouridine for 5 h (experiment 1) or 12 h (experiment 2). After 0, 2, 5, 7, and 10 days of chase (experiment 1) and 0, 4, 8, and 12 days of chase (experiment 2), cells derived from the same original numbers of labeled cells were collected. RNA was extracted, thiouridine-labeled RNA was purified, and two-step quantitative RT-PCR was performed to quantitate the number of hTR molecules in 1/10 of each purified RNA sample. An example of the final quantitation step of 4-thiouridine-labeled RNA from BJ hTERT cells is shown. Lane M contains the 5′-32P-end-labeled 10-bp marker (GIBCO BRL), and lane B is the blank (no template in the PCR step). The amount of competitor RNA (in picograms) in each lane is also indicated.
FIG. 5
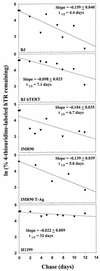
Half-life of hTR. Plots of ln (% 4-thiouridine-labeled hTR remaining) versus chase time for each cell type. The numbers of hTR molecules determined by quantitative RT-PCR for BJ, BJ hTERT, IMR90, IMR90 T-Ag, and H1299 at each chase time point were expressed as percentages of their initial values, and these percentages were used to prepare the logarithmic plots. The slopes (−k ± standard error) of these lines were estimated by linear regression and used to calculate the half-life of hTR in each cell strain or cell line, using the formula t_1/2 = (ln 2)/−_k. The half-lives of hTR in BJ, BJ hTERT, IMR90, IMR90 T-Ag, and H1299 cells were determined to be 4.4, 7.1, 6.7, 5.0, and 32 days, respectively (Table 3). The different symbols represent data from two independent experiments (●, experiment 1; ▾, experiment 2) performed for all cell types other than IMR90 T-Ag.
Similar articles
- Quantitation of telomerase components and hTERT mRNA splicing patterns in immortal human cells.
Yi X, Shay JW, Wright WE. Yi X, et al. Nucleic Acids Res. 2001 Dec 1;29(23):4818-25. doi: 10.1093/nar/29.23.4818. Nucleic Acids Res. 2001. PMID: 11726691 Free PMC article. - Functional regions of human telomerase reverse transcriptase and human telomerase RNA required for telomerase activity and RNA-protein interactions.
Bachand F, Autexier C. Bachand F, et al. Mol Cell Biol. 2001 Mar;21(5):1888-97. doi: 10.1128/MCB.21.5.1888-1897.2001. Mol Cell Biol. 2001. PMID: 11238925 Free PMC article. - Expression of telomerase genes in thyroid carcinoma.
Hoang-Vu C, Boltze C, Gimm O, Poremba C, Dockhorn-Dworniczak B, Köhrle J, Rath FW, Dralle H. Hoang-Vu C, et al. Int J Oncol. 2002 Aug;21(2):265-72. Int J Oncol. 2002. PMID: 12118320 Review. - How RNAi machinery enters the world of telomerase.
Laudadio I, Carissimi C, Fulci V. Laudadio I, et al. Cell Cycle. 2019 May;18(10):1056-1067. doi: 10.1080/15384101.2019.1609834. Epub 2019 May 7. Cell Cycle. 2019. PMID: 31014212 Free PMC article. Review.
Cited by
- N-terminal residues of human dyskerin are required for interactions with telomerase RNA that prevent RNA degradation.
MacNeil DE, Lambert-Lanteigne P, Autexier C. MacNeil DE, et al. Nucleic Acids Res. 2019 Jun 4;47(10):5368-5380. doi: 10.1093/nar/gkz233. Nucleic Acids Res. 2019. PMID: 30931479 Free PMC article. - Yes-associated protein 1 as a prognostic biomarker and its correlation with telomerase in various cancers.
Kim HR, Seo CW, Yoo K, Han SJ, Kim J. Kim HR, et al. Osong Public Health Res Perspect. 2021 Oct;12(5):324-332. doi: 10.24171/j.phrp.2021.0207. Epub 2021 Sep 17. Osong Public Health Res Perspect. 2021. PMID: 34719224 Free PMC article. - Telomerase reverse transcriptase is required for the localization of telomerase RNA to cajal bodies and telomeres in human cancer cells.
Tomlinson RL, Abreu EB, Ziegler T, Ly H, Counter CM, Terns RM, Terns MP. Tomlinson RL, et al. Mol Biol Cell. 2008 Sep;19(9):3793-800. doi: 10.1091/mbc.e08-02-0184. Epub 2008 Jun 18. Mol Biol Cell. 2008. PMID: 18562689 Free PMC article. - Implications of telomerase reverse transcriptase in tumor metastasis.
Zou Y, Cong YS, Zhou J. Zou Y, et al. BMB Rep. 2020 Sep;53(9):458-465. doi: 10.5483/BMBRep.2020.53.9.108. BMB Rep. 2020. PMID: 32731912 Free PMC article. Review. - Telomere length homeostasis requires that telomerase levels are limiting.
Cristofari G, Lingner J. Cristofari G, et al. EMBO J. 2006 Feb 8;25(3):565-74. doi: 10.1038/sj.emboj.7600952. Epub 2006 Jan 19. EMBO J. 2006. PMID: 16424902 Free PMC article.
References
- Avilion A A, Piatyszek M A, Gupta J, Shay J W, Bacchetti S, Greider C W. Human telomerase RNA and telomerase activity in immortal cell lines and tumor tissues. Cancer Res. 1996;56:645–650. - PubMed
- Beattie T L, Zhou W, Robinson M O, Harrington L. Reconstitution of human telomerase activity in vitro. Curr Biol. 1998;8:177–180. - PubMed
- Blasco M A, Lee H W, Hande M P, Samper E, Lansdorp P M, DePinho R A, Greider C W. Telomere shortening and tumor formation by mouse cells lacking telomerase RNA. Cell. 1997;91:25–34. - PubMed
- Bodnar A G, Ouellette M, Frolkis M, Holt S E, Chiu C P, Morin G B, Harley C B, Shay J W, Lichtsteiner S, Wright W E. Extension of life-span by introduction of telomerase into normal human cells. Science. 1998;279:349–352. - PubMed
- Bryan T M, Marusic L, Bacchetti S, Namba M, Reddel R R. The telomere lengthening mechanism in telomerase-negative immortal human cells does not involve the telomerase RNA subunit. Hum Mol Genet. 1997;6:921–926. - PubMed
Publication types
MeSH terms
Substances
LinkOut - more resources
Full Text Sources
Other Literature Sources


