Broad patterns of gene expression revealed by clustering analysis of tumor and normal colon tissues probed by oligonucleotide arrays - PubMed (original) (raw)
Broad patterns of gene expression revealed by clustering analysis of tumor and normal colon tissues probed by oligonucleotide arrays
U Alon et al. Proc Natl Acad Sci U S A. 1999.
Abstract
Oligonucleotide arrays can provide a broad picture of the state of the cell, by monitoring the expression level of thousands of genes at the same time. It is of interest to develop techniques for extracting useful information from the resulting data sets. Here we report the application of a two-way clustering method for analyzing a data set consisting of the expression patterns of different cell types. Gene expression in 40 tumor and 22 normal colon tissue samples was analyzed with an Affymetrix oligonucleotide array complementary to more than 6,500 human genes. An efficient two-way clustering algorithm was applied to both the genes and the tissues, revealing broad coherent patterns that suggest a high degree of organization underlying gene expression in these tissues. Coregulated families of genes clustered together, as demonstrated for the ribosomal proteins. Clustering also separated cancerous from noncancerous tissue and cell lines from in vivo tissues on the basis of subtle distributed patterns of genes even when expression of individual genes varied only slightly between the tissues. Two-way clustering thus may be of use both in classifying genes into functional groups and in classifying tissues based on gene expression.
Figures
Figure 1
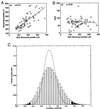
Correlation between pairs of genes across the 62 tissue types. ○, tumor tissues; □, normal tissue; line, best fit (least-mean squares) with correlation coefficient r. (A) Correlation between 60S ribosomal protein L22 (EST number T47584) and ribosomal protein L3 (T57630). (B) 60S ribosomal protein L22 and her2 (M11730). Intensities are a measure of the mRNA concentration with 100 intensity units equal to roughly 10 messages/cell (8). (C) Probability histogram of correlation coefficients between pairs of genes. All pairs within the 2,000 genes with highest minimal intensity across the tissues were used. Dashed line, correlation coefficient for data where identity of tissues was randomized. Shaded regions, correlation with statistical significance P < 10−3. On average each gene scores such a significant correlation with about 30 other genes, and such an anticorrelation with about 10 other genes.
Figure 2
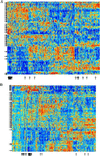
Data set of intensities of 2,000 genes in 22 normal and 40 tumor colon tissues. The genes chosen are the 2,000 genes with highest minimal intensity across the samples. The vertical axis corresponds to genes, and the horizontal axis to tissues. Each gene was normalized so its average intensity across the tissues is 0, and its SD is 1. The color code used is indicated in the adjoining scale. (A) Unclustered data set. (B) Clustered data. The 62 tissues are arranged on the vertical axis according to the ordered tree of Fig. 3. The 2,000 genes are arranged on the horizontal axis according to their ordered tree. (C) Unclustered randomized data, where the original data set was randomized (the location of each number in the matrix was randomly shifted). (D) Clustered randomized data, subjected to the same clustering algorithm as in B. The data and the clustering program are available at
http://www.molbio.princeton.edu/colondata
.
Figure 3
(A) Expanded view of clustered data set of 2,000 genes in 22 normal and 40 tumor colon tissues. The genes chosen are the 2,000 genes with highest minimal intensity across the samples. Tumor tissues are marked with arrows on the left. Normal tissues are unmarked. Note the separation of normal and tumor tissues. Thin black vertical arrows on the bottom mark ESTs homologous to ribosomal proteins (see Table 1). Note that where these genes cluster the arrows group together and resemble a thick arrow. (B) Same as A but with EB and EB1 colon carcinoma cell lines (17) added to the data set (marked with ∗∗). Note the clustering of cell lines into a separate group with expression patterns markedly different from both tumor and normal in vivo tissues.
Figure 4
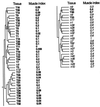
Clustering tree for the tissue samples. Tumors (T) and normal tissue (n) numbered such that tumor and normal tissues with the same serial number originate from the same patient. Tissue T18 is a tumor and tissue T19 is a metastasis from the same patient. The muscle index for each tissue is shown. The muscle index was defined as the average intensity of the ESTs on the array that are homologous to the following 17 smooth muscle genes: (D42054) human ORF (smooth muscle myosin-related), complete cds; (U37019) human smooth muscle cell calponin mRNA, complete cds; (T61597, R01216, T78485) caldesmon, smooth muscle (Gallus gallus); (T60155) actin, aortic smooth muscle (human); (M95787) smooth muscle protein 22-alpha (human); (J02854) myosin regulatory light chain 2, smooth muscle isoform (human); (T97948) calponin h2, smooth muscle (Sus scrofa); (R16199, R42761, R50839, H30638, T55741) myosin light chain kinase, smooth muscle (Gallus gallus); (T96548) actin, gamma-enteric smooth muscle (human); (X12369) tropomyosin alpha chain, smooth muscle (human); (H20709) myosin light chain alkali, smooth-muscle isoform (human). The index is normalized to vary between 0.0 and 1.0. The horizontal distance between tree nodes was determined by the relative value of β at which splitting occurred in the clustering algorithm (see Materials and Methods).
Figure 5
Separation of tumor and normal tissues by clustering over a set of 500 genes. Genes were sorted by statistical significance (t test) of the difference in normal and tumors. Tissues were clustered by using a window of 500 genes selected from the sorted genes. The vertical axis denotes the fraction of tumors in the tumor rich cluster (|T − N|/(T + N) where N and T are the number of normal, tumor tissues). Dashed line indicates separation in a randomized data set. The horizontal axis denotes the starting point of the 500-gene window, so that at the left-hand side the most significant 500 genes are used, and at the right the least significant 500 genes.
Similar articles
- Transcriptional gene expression profiles of colorectal adenoma, adenocarcinoma, and normal tissue examined by oligonucleotide arrays.
Notterman DA, Alon U, Sierk AJ, Levine AJ. Notterman DA, et al. Cancer Res. 2001 Apr 1;61(7):3124-30. Cancer Res. 2001. PMID: 11306497 - Expression profiling of colon cancer cell lines and colon biopsies: towards a screening system for potential cancer-preventive compounds.
van Erk MJ, Krul CA, Caldenhoven E, Stierum RH, Peters WH, Woutersen RA, van Ommen B. van Erk MJ, et al. Eur J Cancer Prev. 2005 Oct;14(5):439-57. doi: 10.1097/01.cej.0000174781.51883.21. Eur J Cancer Prev. 2005. PMID: 16175049 - Application of gene shaving and mixture models to cluster microarray gene expression data.
Do KA, McLachlan GJ, Bean R, Wen S. Do KA, et al. Cancer Inform. 2007;5:25-43. Epub 2007 Apr 2. Cancer Inform. 2007. PMID: 19390667 Free PMC article. - Multistage gene expression profiling in a differentially susceptible mouse colon cancer model.
Guda K, Cui H, Garg S, Dong M, Nambiar PR, Achenie LE, Rosenberg DW. Guda K, et al. Cancer Lett. 2003 Feb 28;191(1):17-25. doi: 10.1016/s0304383502006195. Cancer Lett. 2003. PMID: 12609705 - Application of gene expression profiling to colon cell maturation, transformation and chemoprevention.
Augenlicht LH, Velcich A, Klampfer L, Huang J, Corner G, Aranes M, Laboisse C, Rigas B, Lipkin M, Yang K, Shi Q, Lesser M, Heerdt B, Arango D, Yang W, Wilson A, Mariadason JM. Augenlicht LH, et al. J Nutr. 2003 Jul;133(7 Suppl):2410S-2416S. doi: 10.1093/jn/133.7.2410S. J Nutr. 2003. PMID: 12840217 Review.
Cited by
- Deep learning assisted cancer disease prediction from gene expression data using WT-GAN.
Ravindran U, Gunavathi C. Ravindran U, et al. BMC Med Inform Decis Mak. 2024 Oct 24;24(1):311. doi: 10.1186/s12911-024-02712-y. BMC Med Inform Decis Mak. 2024. PMID: 39449042 Free PMC article. - An Improved Binary Walrus Optimizer with Golden Sine Disturbance and Population Regeneration Mechanism to Solve Feature Selection Problems.
Geng Y, Li Y, Deng C. Geng Y, et al. Biomimetics (Basel). 2024 Aug 18;9(8):501. doi: 10.3390/biomimetics9080501. Biomimetics (Basel). 2024. PMID: 39194480 Free PMC article. - Metaheuristic integrated machine learning classification of colon cancer using STFT LASSO and EHO feature extraction from microarray gene expressions.
Nair AR, Rajaguru H, Karthika MS, Keerthivasan C. Nair AR, et al. Sci Rep. 2024 Jul 17;14(1):16485. doi: 10.1038/s41598-024-67135-1. Sci Rep. 2024. PMID: 39019906 Free PMC article. - An improved mountain gazelle optimizer based on chaotic map and spiral disturbance for medical feature selection.
Li Y, Geng Y, Sheng H. Li Y, et al. PLoS One. 2024 Jul 16;19(7):e0307288. doi: 10.1371/journal.pone.0307288. eCollection 2024. PLoS One. 2024. PMID: 39012921 Free PMC article. - A Bayesian hierarchical hidden Markov model for clustering and gene selection: Application to kidney cancer gene expression data.
Chekouo T, Mukherjee H. Chekouo T, et al. Biom J. 2024 Jun;66(4):e2300173. doi: 10.1002/bimj.202300173. Biom J. 2024. PMID: 38817110 Free PMC article.
References
- Lockhart D, Dong H, Byrne M, Follettie M, Gallo M, Chee M, Mittmann M, Wang C, Kobayashi M, Horton H, Brown E. Nat Biotechnol. 1996;14:1675–1680. - PubMed
- DeRisi J, Penland L, Brown P, Bittner M, Meltzer P, Ray M, Chen Y, Su Y, Trent J. Nat Genet. 1996;14:457–460. - PubMed
- Pietu G, Alibert O, Guichard V, Lamy B, Bois F, Leroy E, Mariage-Sampson R, Houlgatte R, Soularue P, Auffray C. Genome Res. 1996;6:492–503. - PubMed
- Wodicka L, Dong H, Mittmann M, Ho M, Lockhart D. Nat Biotechnol. 1997;15:1359–1367. - PubMed
- DeRisi J, Iyer V, Brown P. Science. 1997. 680–686. - PubMed
MeSH terms
Substances
LinkOut - more resources
Full Text Sources
Other Literature Sources


