Differences in the localization and morphology of chromosomes in the human nucleus - PubMed (original) (raw)
Comparative Study
Differences in the localization and morphology of chromosomes in the human nucleus
J A Croft et al. J Cell Biol. 1999.
Abstract
Using fluorescence in situ hybridization we show striking differences in nuclear position, chromosome morphology, and interactions with nuclear substructure for human chromosomes 18 and 19. Human chromosome 19 is shown to adopt a more internal position in the nucleus than chromosome 18 and to be more extensively associated with the nuclear matrix. The more peripheral localization of chromosome 18 is established early in the cell cycle and is maintained thereafter. We show that the preferential localization of chromosomes 18 and 19 in the nucleus is reflected in the orientation of translocation chromosomes in the nucleus. Lastly, we show that the inhibition of transcription can have gross, but reversible, effects on chromosome architecture. Our data demonstrate that the distribution of genomic sequences between chromosomes has implications for nuclear structure and we discuss our findings in relation to a model of the human nucleus that is functionally compartmentalized.
Figures
Figure 3
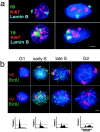
HSA18 and 19 territories through the cell cycle. (a) Combined FISH and immunofluorescence in 4% pFa–fixed 3D fibroblasts with either chromosome 18 or 19 paints (green) and with antibodies against pKi-67 (red) and B-type lamin (blue). The cells on the left are in early stages of G1 and those on the right in mid G1, S, or G2 based on their pattern of pKi-67 staining (Bridger et al., 1998). Bar, 5 μm. (b) FISH for HSA18 or 19 (red) in flattened preparations of MAA-fixed lymphoblast nuclei, pulsed with BrdU (green), and separated by centrifugal elutriation. Blue is DAPI. Bar, 2 μm. FACS® analyses of PI-stained nuclei from elutriated fractions chosen to represent G1, early S, late S, and G2 are shown beneath each panel. Horizontal bars on the FACS® profiles indicate the gating for cells in G1 (left) and for those in S and G2 (right).
Figure 1
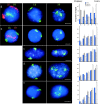
Human chromosomes 18 and 19 interphase territories. 2D preparations of nuclei, swollen in hypotonic and fixed either with MAA (a–d) or with 4% pFa (e), were hybridized with HSA18 and 19 paints. In the central panels of a–e HSA18 and 19 paints were biotinylated and detected with avidin-FITC (green). In the left-hand panels of a and b, paints were labeled either with biotin and detected with TR (red) or with digoxigenin and detected with FITC (green). All nuclei were counterstained with DAPI (blue). (a) Primary lymphocytes; (b and e) lymphoblastoid cell line; (c) primary fibroblasts; (d) HT1080 fibrosarcoma cells. Bars, 2 μm. On the right, histograms show the mean proportion of DAPI stain (blue bars), and HSA18 (filled bars) and HSA19 (open bars) hybridization signals in each of the five concentric shells of equal area eroded from the periphery (1) to the center (5) of 50 segmented nuclei. Error bars show SEM.
Figure 2
Subnuclear localization of HSA18 and 19 in optical sections through 3D-preserved nuclei. Confocal z series (1 μm) of hybridization to 4% pFa–fixed 3D human dermal fibroblasts with paints for either HSA18 (a and b) or HSA19 (c and d), prepared from randomly amplified total DNA from each chromosome and detected with FITC (green-yellow) and counterstained with PI (red). Cells were either untreated (a and c) or treated with DRB (b and d). Bars, 10 μm.
Figure 4
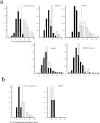
Dependence of territory sizes on transcription and histone deacetylation. (a) Frequency histograms of the proportion of nuclear area occupied by hybridization signals (detected with FITC) of HSA18 (filled bars) and 19 (open bars) in 50 swollen and flattened MAA-fixed lymphoblastoid nuclei. (b) Histograms of the proportion of summed nuclear area occupied by hybridization signals (detected with FITC) of HSA18 (filled bars) and 19 (open bars) through the confocal sections of 5–10 fibroblast nuclei fixed with 4% pFa. Vertical solid and dashed lines show mean proportionate areas for HSA18 and 19, respectively. Cells were either untreated, or treated with AMD, DRB, or TSA before harvest. DRB-treated cells were also grown for 1 h in the absence of DRB (DRB release).
Figure 5
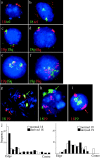
The orientation of chromosomes 18 and 19 in normal nuclei and those from a t(18;19). (a and b) Lymphoblast nuclei cohybridized with paints specific for 18p and q arms (Guan et al., 1996). 18p is in red in a and in green in b. 18q is in the reciprocal color in each case, as indicated. DAPI counterstain is blue. (c and d) Lymphoblast nuclei cohybridized with paints specific for 19p and q arms (Guan et al., 1996). 19p is in red in c and in green in d. 19q is in the reciprocal color in each case, as indicated. DAPI counterstain is blue. (e) Flattened primary lymphocytes hybridized simultaneously with HSA18 paint (red) and telomeric clones 52M11 and 75F20 (green) specific for 18pter and qter, respectively. DAPI counterstain is blue. (f) 3D-preserved nuclei cohybridized with HSA18 paint (green) and telomeric clones 52M11 and 75F20 (red). Red signal in the cytoplasm is from endogenous biotin. Telomere signals are apparent with only one of the territories, those associated with the other territory are in a different focal plane. (g) FISH to a metaphase spread from an individual with t(18; 19)(p11;p13) with chromosome 18 material shown in green and 19 in red. The appropriately colored arrows indicate the derived chromosomes. (h and i) Interphase nuclei from t(18;19) cells. HSA18-derived material is detected in green in h and in red in i. HSA19 is detected in the reciprocal color in each panel as indicated. As in g, appropriately colored arrows indicate the derived chromosomes. A line was drawn from the center to the edge of the nucleus passing through each derived chromosome. A second line, perpendicular to the first, was put through the middle of the signal and it was ascertained which side of this line the translocated portion was found. (j) Histograms of the position of the edge of the signal in relation to the edge or the center of the nucleus, in 50 t(18;19) nuclei, for both the normal (open bars) and derived (filled bars) chromosomes 18 and 19. There is no significant difference in the positions of derived and normal chromosomes (P < 0.059 for HSA18 and P < 0.110 for HSA19).
Figure 6
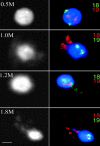
Associations of HSA18 and 19 with nuclear substructure. Lymphoblastoid nuclei extracted with 0.5, 1.0, 1.2, and 1.8 M NaCl, fixed with MAA, and hybridized with alternately labeled chromosome 18 and 19 paints, the color of which is indicated at the right of each panel. DNA was stained with DAPI (shown in blue on the right and in black and white on the left). Chromosome 19 material is retained within the residual nucleus. HSA18 is released into the DNA halo at high salt concentrations. Bar, 2 μm.
Similar articles
- Gene density and transcription influence the localization of chromatin outside of chromosome territories detectable by FISH.
Mahy NL, Perry PE, Bickmore WA. Mahy NL, et al. J Cell Biol. 2002 Dec 9;159(5):753-63. doi: 10.1083/jcb.200207115. Epub 2002 Dec 9. J Cell Biol. 2002. PMID: 12473685 Free PMC article. - Reversible disruption of pericentric heterochromatin and centromere function by inhibiting deacetylases.
Taddei A, Maison C, Roche D, Almouzni G. Taddei A, et al. Nat Cell Biol. 2001 Feb;3(2):114-20. doi: 10.1038/35055010. Nat Cell Biol. 2001. PMID: 11175742 - Nuclear architecture.
Marshall WF, Sedat JW. Marshall WF, et al. Results Probl Cell Differ. 1999;25:283-301. doi: 10.1007/978-3-540-69111-2_14. Results Probl Cell Differ. 1999. PMID: 10339752 Review. No abstract available. - HIPMap: A High-Throughput Imaging Method for Mapping Spatial Gene Positions.
Shachar S, Pegoraro G, Misteli T. Shachar S, et al. Cold Spring Harb Symp Quant Biol. 2015;80:73-81. doi: 10.1101/sqb.2015.80.027417. Epub 2015 Oct 15. Cold Spring Harb Symp Quant Biol. 2015. PMID: 26472748 Free PMC article. Review.
Cited by
- Chromosome conformation capture technologies and their impact in understanding genome function.
Sati S, Cavalli G. Sati S, et al. Chromosoma. 2017 Feb;126(1):33-44. doi: 10.1007/s00412-016-0593-6. Epub 2016 Apr 30. Chromosoma. 2017. PMID: 27130552 Review. - RNA Biogenesis Instructs Functional Inter-Chromosomal Genome Architecture.
Bertero A. Bertero A. Front Genet. 2021 Mar 1;12:645863. doi: 10.3389/fgene.2021.645863. eCollection 2021. Front Genet. 2021. PMID: 33732290 Free PMC article. - Reliable detection of epigenetic histone marks and nuclear proteins in tissue cryosections.
Eberhart A, Kimura H, Leonhardt H, Joffe B, Solovei I. Eberhart A, et al. Chromosome Res. 2012 Oct;20(7):849-58. doi: 10.1007/s10577-012-9318-8. Epub 2012 Nov 2. Chromosome Res. 2012. PMID: 23117894 - Genome-wide identification of copy neutral loss of heterozygosity reveals its possible association with spatial positioning of chromosomes.
Kim H, Suyama M. Kim H, et al. Hum Mol Genet. 2023 Mar 20;32(7):1175-1183. doi: 10.1093/hmg/ddac278. Hum Mol Genet. 2023. PMID: 36349694 Free PMC article. - A mechanical basis for chromosome function.
Kleckner N, Zickler D, Jones GH, Dekker J, Padmore R, Henle J, Hutchinson J. Kleckner N, et al. Proc Natl Acad Sci U S A. 2004 Aug 24;101(34):12592-7. doi: 10.1073/pnas.0402724101. Epub 2004 Aug 6. Proc Natl Acad Sci U S A. 2004. PMID: 15299144 Free PMC article.
References
- Andrulis ED, Neiman AM, Zappulla DC, Sternglanz R. Perinuclear localization of chromatin facilitates transcriptional silencing. Nature. 1998;394:592–595. - PubMed
- Bickmore WA, Carothers AD. Factors affecting the timing and imprinting of replication on a mammalian chromosome. J Cell Sci. 1995;108:2801–2809. - PubMed
- Bickmore WA, Oghene K. Visualizing the spatial relationships between defined DNA sequences and the axial region of extracted metaphase chromosomes. Cell. 1996;84:95–104. - PubMed
- Bridger JM, Bickmore WA. Putting the genome on the map. Trends Genet. 1998;14:403–409. - PubMed
Publication types
MeSH terms
Substances
LinkOut - more resources
Full Text Sources
Other Literature Sources
