Abnormalities in neuronal process extension, hippocampal development, and the ventricular system of L1 knockout mice - PubMed (original) (raw)
Abnormalities in neuronal process extension, hippocampal development, and the ventricular system of L1 knockout mice
G P Demyanenko et al. J Neurosci. 1999.
Abstract
In humans, mutations in the L1 cell adhesion molecule are associated with a neurological syndrome termed CRASH, which includes corpus callosum agenesis, mental retardation, adducted thumbs, spasticity, and hydrocephalus. A mouse model with a null mutation in the L1 gene (Cohen et al., 1997) was analyzed for brain abnormalities by Nissl and Golgi staining and immunocytochemistry. In the motor, somatosensory, and visual cortex, many pyramidal neurons in layer V exhibited undulating apical dendrites that did not reach layer I. The hippocampus of L1 mutant mice was smaller than normal, with fewer pyramidal and granule cells. The corpus callosum of L1-minus mice was reduced in size because of the failure of many callosal axons to cross the midline. Enlarged ventricles and septal abnormalities were also features of the mutant mouse brain. Immunoperoxidase staining showed that L1 was abundant in developing neurons at embryonic day 18 (E18) in wild-type cerebral cortex, hippocampus, and corpus callosum and then declined to low levels with maturation. In the E18 cortex, L1 colocalized with microtubule-associated protein 2, a marker of dendrites and somata. These new findings suggest new roles for L1 in the mechanism of cortical dendrite differentiation, as well as in guidance of callosal axons and regulation of hippocampal development. The phenotype of the L1 mutant mouse indicates that it is a potentially valuable model for the human CRASH syndrome.
Figures
Fig. 1.
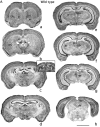
Nissl-stained sections of brains of wild-type (A) and L1-minus (B) mice showing anatomical differences in the ventricles, corpus callosum, septum, and hippocampus. Serial frontal sections in rostral to caudal direction (a–h) were stained by the Nissl technique. Wild-type and mutation sections (a–h; Bregma 0.50–4.16 mm, wild type) are from corresponding anatomical levels. Scale bar, 2500 μm. Insert in C shows corresponding anatomical levels from postnatal day 0 mice. No corpus callosum is apparent at this stage in wild-type (Fig.1_A_, insert in c) or L1-minus mice (Fig. 1_B_, insert in_c_). Scale bar, 1000 μm. ac, Anterior commissure; Aq, aqueduct of Sylvius; cc, corpus callosum; CPu, caudate putamen;D3V, dorsal third ventricle; f, fornix;fi, fimbria; LV, lateral ventricle;sn, septal nuclei; 3V, third ventricle;th, thalamus; HC, hippocampus;SC, superior colliculus; Pb, Probst bundle; pc, posterior commissure.
Fig. 2.
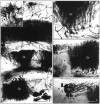
Cytoarchitecture of the smaller L1-minus hippocampus showing pyramidal and granule cell abnormalities. Frontal sections of the L1-minus mouse brain containing the hippocampus were stained by the Golgi technique to reveal neuronal cell bodies and their processes. Py, Pyramidal neuron; Gr, granule neuron; a, axon; d, dendrite.A, Pyramidal cells with atypical wavy dendrites (arrows). Scale bar, 50 μm. B, Section showing the CA1 region of the pyramidal layer and the dentate gyrus with normal layers and cytoarchitecture. Scale bar, 100 μm.C, Granule cells in dentate gyrus showing axons (a) and dendrites (d) with a normal orientation. Scale bar, 50 μm. D, Region of dentate gyrus with a group of displaced granule cells bearing misoriented dendrites (box delineated by_dashed line_). Scale bar, 50 μm. E, Higher magnification of area delineated by _dashed line_in D. Scale bar, 50 μm.
Fig. 3.
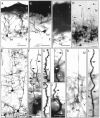
Abnormal apical dendrites of pyramidal neurons in the L1-minus cerebral cortex. Frontal sections through the wild-type and L1-minus brain were stained by the Golgi technique to reveal neuronal cell bodies and their processes in different regions of the cerebral cortex. Scale bars, 50 μm. A, Motor cortex of wild-type mouse showing normal pyramidal cell in layer II with well developed apical and basal dendrites. B, C, Motor cortex of L1-minus mice showing pyramidal cells in layer II with apical dendrites (ad) that were directed laterally with respect to layer I (I). D, Visual cortex of L1-minus mouse showing layer V pyramidal cells with apical dendrites lacking apical tufts (arrows) terminating in layer IV. E, Visual cortex of wild-type mouse showing pyramidal neurons in layers V–VI with straight and well formed apical dendrites (ad) and basal dendrites (bd).F–J, Visual cortex of L1-minus mice showing pyramidal neurons in layer V with wavy apical dendrites terminating in layer V (arrows) and reduced branching. Computer reconstruction in F was used to align focal planes. K, Somatosensory cortex of wild-type mouse showing pyramidal neurons in layers V–VI with straight and highly branched apical dendrites.L, Somatosensory cortex of L1-minus mouse showing a pyramidal neuron in layers V–VI with a curved apical dendrite (arrows).
Fig. 4.
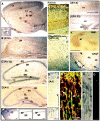
Developmental regulation of L1 expression in wild-type mouse brain. Immunoperoxidase staining of fixed sections of wild-type mouse brain at embryonic day 18 (E18), postnatal day 33 (Pd 33), and adult stained by the avidin–biotinylated peroxidase method using rabbit polyclonal antibody 6096 directed against L1 and counterstained with toluidine blue. Scale bar, 200 μm. A, Sagittal section from E18 mouse brain showing L1 strongly expressed in the cerebral cortex (cx), corpus callosum (cc), internal capsule (IC), stria terminalis (ST), hippocampus (HC), fimbria (Fi), and habenulo-peduncular tract (HP). Ependymal cells lining the lateral ventricle (LV) and third ventricle (3V; insert magnification threefold) were not stained. B, Hippocampus of E18 brain showing strong L1 staining in the developing stratum pyramidale (SP).C, Frontal section of postnatal day 33 hippocampus showing moderate L1 staining of approximately one-third of cell bodies in the SP and granular (Gr) layers, and low-level L1 staining in the stratum oriens (S), stratum radiatum (SR), and stratum moleculare (SM). D, Frontal section of adult (Ad) hippocampus showing moderate L1 staining of the stratum lacunosum moleculare (SL), low-level staining of process-rich layers, and no staining of the SP or Gr layers. E, Normal Ig control staining of E18 mouse brain (left), Pd33 hippocampus (middle), and adult hippocampus (right).F, Frontal section of the E18 visual cortex showing L1 staining in the marginal zone (Mz) and intermediate zone (Iz), and lower levels of staining in the cortical plate (Cp) and ventricular zone (V). G, Frontal section of Pd 33 visual cortex showing L1 staining of neuronal cell bodies in layers II–V and in processes of layer I. H, Frontal section of adult (Ad) visual cortex showing reduction of L1 staining in cortical layers I–V. Insert(bottom of H) shows higher magnification of layer II. I, Frontal section of E18 showing L1 staining of the corpus callosum. J, Frontal section of Pd 33 brain reduction in L1 staining in the corpus callosum.cp, Choroid plexus. K, Frontal section of adult L1-minus brain showing myelin basic protein (MBP) staining of Probst bundle (arrow). L, Glial fibrillary acid protein immunoreactivity of Probst bundle (arrows) adjacent to lateral ventricle (LV) of an L1-minus adult mouse.M, Frontal section of E18 visual cortex showing double-immunofluorescence staining of L1 (fluorescein) and MAP2 (rhodamine) by confocal microscopy in a computer-generated color overlay. Yellow indicates colocalization of L1 and MAP2.N, The same field as in M visualized by differential interference contrast microscopy. Black arrows point to the same sites as _white arrows_in M. O, Control staining of E18 visual cortex with normal rabbit Ig (fluorescein) and normal mouse Ig (rhodamine) visualized by confocal microscopy in a computer-generated color overlay.
Similar articles
- Novel missense mutation in the L1 gene in a child with corpus callosum agenesis, retardation, adducted thumbs, spastic paraparesis, and hydrocephalus.
Sztriha L, Frossard P, Hofstra RM, Verlind E, Nork M. Sztriha L, et al. J Child Neurol. 2000 Apr;15(4):239-43. doi: 10.1177/088307380001500407. J Child Neurol. 2000. PMID: 10805190 - Genotype-phenotype correlation in L1 associated diseases.
Fransen E, Van Camp G, D'Hooge R, Vits L, Willems PJ. Fransen E, et al. J Med Genet. 1998 May;35(5):399-404. doi: 10.1136/jmg.35.5.399. J Med Genet. 1998. PMID: 9610803 Free PMC article. - Expression of L1 and TAG-1 in the corticospinal, callosal, and hippocampal commissural neurons in the developing rat telencephalon as revealed by retrograde and in situ hybridization double labeling.
Fujimori KE, Takeuchi K, Yazaki T, Uyemura K, Nojyo Y, Tamamki N. Fujimori KE, et al. J Comp Neurol. 2000 Feb 14;417(3):275-88. doi: 10.1002/(sici)1096-9861(20000214)417:3<275::aid-cne2>3.0.co;2-7. J Comp Neurol. 2000. PMID: 10683603 - CRASH syndrome: clinical spectrum of corpus callosum hypoplasia, retardation, adducted thumbs, spastic paraparesis and hydrocephalus due to mutations in one single gene, L1.
Fransen E, Lemmon V, Van Camp G, Vits L, Coucke P, Willems PJ. Fransen E, et al. Eur J Hum Genet. 1995;3(5):273-84. doi: 10.1159/000472311. Eur J Hum Genet. 1995. PMID: 8556302 Review. - L1-associated diseases: clinical geneticists divide, molecular geneticists unite.
Fransen E, Van Camp G, Vits L, Willems PJ. Fransen E, et al. Hum Mol Genet. 1997;6(10):1625-32. doi: 10.1093/hmg/6.10.1625. Hum Mol Genet. 1997. PMID: 9300653 Review.
Cited by
- A new activity of doublecortin in recognition of the phospho-FIGQY tyrosine in the cytoplasmic domain of neurofascin.
Kizhatil K, Wu YX, Sen A, Bennett V. Kizhatil K, et al. J Neurosci. 2002 Sep 15;22(18):7948-58. doi: 10.1523/JNEUROSCI.22-18-07948.2002. J Neurosci. 2002. PMID: 12223548 Free PMC article. - In utero cocaine-induced dysfunction of dopamine D1 receptor signaling and abnormal differentiation of cerebral cortical neurons.
Jones LB, Stanwood GD, Reinoso BS, Washington RA, Wang HY, Friedman E, Levitt P. Jones LB, et al. J Neurosci. 2000 Jun 15;20(12):4606-14. doi: 10.1523/JNEUROSCI.20-12-04606.2000. J Neurosci. 2000. PMID: 10844030 Free PMC article. - Perinatal asphyxia: current status and approaches towards neuroprotective strategies, with focus on sentinel proteins.
Herrera-Marschitz M, Morales P, Leyton L, Bustamante D, Klawitter V, Espina-Marchant P, Allende C, Lisboa F, Cunich G, Jara-Cavieres A, Neira T, Gutierrez-Hernandez MA, Gonzalez-Lira V, Simola N, Schmitt A, Morelli M, Andrew Tasker R, Gebicke-Haerter PJ. Herrera-Marschitz M, et al. Neurotox Res. 2011 May;19(4):603-27. doi: 10.1007/s12640-010-9208-9. Epub 2010 Jul 20. Neurotox Res. 2011. PMID: 20645042 Free PMC article. Review. - Gradient-reading and mechano-effector machinery for netrin-1-induced axon guidance.
Baba K, Yoshida W, Toriyama M, Shimada T, Manning CF, Saito M, Kohno K, Trimmer JS, Watanabe R, Inagaki N. Baba K, et al. Elife. 2018 Aug 7;7:e34593. doi: 10.7554/eLife.34593. Elife. 2018. PMID: 30082022 Free PMC article. - A new role for the cell adhesion molecule L1 in neural precursor cell proliferation, differentiation, and transmitter-specific subtype generation.
Dihné M, Bernreuther C, Sibbe M, Paulus W, Schachner M. Dihné M, et al. J Neurosci. 2003 Jul 23;23(16):6638-50. doi: 10.1523/JNEUROSCI.23-16-06638.2003. J Neurosci. 2003. PMID: 12878705 Free PMC article.
References
- Abel EL, Sokol RJ. Incidence of fetal alcohol syndrome and economic impact of FAS-related anomalies. Drug Alcohol Depend. 1987;19:51–70. - PubMed
- Atashi JR, Klinz SG, Ingraham CA, Matten WT, Schachner M, Maness PF. Neural cell adhesion molecules modulate tyrosine phosphorylation of tubulin in nerve growth cone membranes. Neuron. 1992;8:831–842. - PubMed
- Bailey CH, Kandel ER. Structural changes accompanying memory storage. Annu Rev Physiol. 1993;55:397–426. - PubMed
- Barnes DE, Walker DW. Prenatal ethanol exposure permanently reduces the number of pyramidal neurons in rat hippocampus. Dev Brain Res. 1981;1:333–340. - PubMed
- Bartsch U, Kirchhoff F, Schachner M. Immunohistological localization of the adhesion molecules L1, N-CAM, and MAG in the developing and adult optic nerve of mice. J Cell Neurosci. 1989;284:451–462. - PubMed
Publication types
MeSH terms
Substances
LinkOut - more resources
Full Text Sources
Other Literature Sources
Molecular Biology Databases


