Voltage-dependent neuromodulation of Na+ channels by D1-like dopamine receptors in rat hippocampal neurons - PubMed (original) (raw)
Voltage-dependent neuromodulation of Na+ channels by D1-like dopamine receptors in rat hippocampal neurons
A R Cantrell et al. J Neurosci. 1999.
Abstract
Activation of D1-like dopamine (DA) receptors reduces peak Na+ current in acutely isolated hippocampal neurons through phosphorylation of the alpha subunit of the Na+ channel by cAMP-dependent protein kinase (PKA). Here we report that neuromodulation of Na+ currents by DA receptors via PKA is voltage-dependent in the range of -110 to -70 mV and is also sensitive to concurrent activation of protein kinase C (PKC). Depolarization enhanced the ability of D1-like DA receptors to reduce peak Na+ currents via the PKA pathway. Similar voltage-dependent modulation was observed when PKA was activated directly with the membrane-permeant PKA activator DCl-cBIMPS (cBIMPS; 20 microM), indicating that the membrane potential dependence occurs downstream of PKA. PKA activation caused only a small (-2.9 mV) shift in the voltage dependence of steady-state inactivation and had no effect on slow inactivation or on the rates of entry into the fast or slow inactivated states, suggesting that another mechanism is responsible for coupling of membrane potential changes to PKA modulation. Activation of PKC with a low concentration of the membrane-permeant diacylglycerol analog oleylacetyl glycerol also potentiated modulation by SKF 81297 or cBIMPS, and these effects were most striking at hyperpolarized membrane potentials where PKA modulation was not stimulated by membrane depolarization. Thus, activation of D1-like DA receptors causes a strong reduction in Na+ current via the PKA pathway, but it is effective primarily when it is combined with depolarization or activation of PKC. The convergence of these three distinct signaling modalities on the Na+ channel provides an intriguing mechanism for integration of information from multiple signaling pathways in the hippocampus and CNS.
Figures
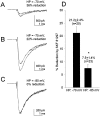
Fig. 1.
Modulation of whole-cell Na+current by D1-like dopamine receptor activation is enhanced at depolarized holding potentials in rat hippocampal neurons.A–C, Representative current traces elicited by a test pulse to −20 mV from the indicated holding potential in control and in the presence of 5 μ
m
SKF 81297 (smaller trace). D, Bar graph summarizing the effect of membrane depolarization on the magnitude of SKF 81297 modulation in a population of neurons (n ≥ 20 for each group). The mean of each population is indicated on the graph. An_asterisk_ indicates statistical significance (p ≤ 0.05; Student’s _t_test).
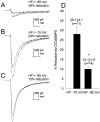
Fig. 2.
Membrane potential-dependent modulation of Na+ current by cBIMPS in rat hippocampal neurons.A–C, Representative current traces elicited by a test pulse to −20 mV from the indicated holding potential in control and in the presence of 50 μ
m
cBIMPS (smaller trace). D, Bar graph summarizing the effect of membrane depolarization on the magnitude of cBIMPS modulation in a population of neurons. An asterisk indicates statistical significance (p ≤ 0.05; Student’s_t_ test).
Fig. 3.
Membrane potential-dependent modulation of Na+ current by cBIMPS in tsA-201 cells transiently transfected with type IIA Na+ channel α subunits. A–C, Representative current traces elicited by a test pulse to 0 mV from the indicated holding potential in control and in the presence of 50 μ
m
cBIMPS (smaller trace). D, Bar graph summarizing the effect of membrane depolarization on the magnitude of cBIMPS modulation in a population of tsA-201 cells expressing type IIA Na+ channel α subunits. An_asterisk_ indicates statistical significance (p < 0.05; Student’s _t_test).
Fig. 4.
Effects of PKA phosphorylation on the voltage dependence of steady-state inactivation. A, From a holding potential of −70 mV, hippocampal neurons were depolarized to the indicated membrane potentials for 50 msec and then further depolarized to 0 mV to record peak Na+ currents. Steady-state fast inactivation curves are presented for control conditions (●) and in the presence of 10 μ
m
SKF 81297 (○). B, Box plot summarizing the effects of PKA phosphorylation on the half-inactivation voltage and the slope factor. An asterisk indicates statistical significance (p ≤ 0.05; Student’s _t_test). C, The peak Na+ current in response to test pulses to OmV is plotted as a function of time in control (●) or 50 μ
m
cBIMPS (○) in response to depolarization of the membrane to the indicated holding potential.D, Voltage dependence of the sum of fast and slow inactivation of control and in the presence of cBIMPS derived from the data in C.
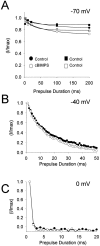
Fig. 5.
Effects of PKA phosphorylation on the rate of inactivation. A, Hippocampal neurons were depolarized to −70 mV for the indicated times and then peak currents were recorded at 0 mV. A plot of normalized peak current versus prepulse duration at −70 mV in control conditions (●) and cBIMPS (○). The solid lines are single exponential fits of the data to determine the inactivation rate constant. Note that the small increase in inactivation in the presence of cBIMPS was also observed when the pulse protocol was repeated twice in the absence of cBIMPS (▪ vs ■). B, Plot of normalized peak current versus prepulse duration at −40 mV in control and in the presence of 50 μ
m
cBIMPS demonstrating the rate inactivation from the final closed states. C, Plot of normalized peak current versus prepulse duration at 0 mV in control and in the presence of 50 μ
m
cBIMPS demonstrating the rate of inactivation from the open state.
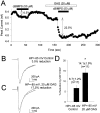
Fig. 6.
Modulation by SKF 81297 and cBIMPS is enhanced by activation of PKC at a hyperpolarized holding potential in rat hippocampal neurons. A, Time course of modulation by cBIMPS in the presence and absence of OAG. The peak current is plotted as a function of time in the presence of various neuromodulators as indicated by the bars. B, C, Representative current traces elicited by a test pulse to −20 mV from a holding potential of −85 mV demonstrating modulation by SKF 81297 with or without previous activation of PKC by OAG.D, Bar graph summarizing the facilitatory effect of previous exposure to a low dose (20 μ
m
) of OAG on the magnitude of SKF 81297 modulation in a population of neurons. An_asterisk_ indicates statistical significance (p ≤ 0.05; Student’s _t_test).
Fig. 7.
Modulation by cBIMPS is also potentiated by PKC activation in transiently transfected tsA-201 cells expressing type IIA Na+ channel α subunits. A, B, Representative current traces elicited by a test pulse to 0 mV from the indicated holding potential demonstrating modulation by cBIMPS without (A) or with (B) previous activation of PKC by OAG.C, Bar graph summarizing the facilitatory effect of previous exposure to a low dose (20 μ
m
) of OAG on the magnitude of cBIMPS modulation in a population of tsA-201 cells. An_asterisk_ indicates statistical significance (p ≤ 0.05; Student’s _t_test).
Fig. 8.
Membrane potential-dependent enhancement of PKA modulation does not require phosphorylation by PKC. A, B, Peak current elicited by a test pulse to −20 mV from a holding potential of −70 mV plotted as a function of time in control solution and in the presence of 50 μ
m
cBIMPS for a control cell and for a cell dialyzed with 20 μ
m
PKCI.C, Bar graph summarizing the magnitude of PKA modulation in control and in the presence of 20 μ
m
PKCI for a population of neurons. An asterisk indicates statistical significance (p ≤ 0.05; Student’s_t_ test).
Fig. 9.
D1/PKA modulation is voltage dependent in tsA-201 cells expressing mutant S1506A Na+ channel α subunits. A, B, Representative current traces elicited by a test pulse to 0 mV from the indicated holding potential in control and in the presence of 5 μ
m
SKF 81297 (smaller trace). C, Bar graph summarizing the effect of membrane depolarization on the magnitude of SKF 81297 modulation in a population of tsA-201 cells (n ≥ 20 for each group). The mean of each population is indicated on the graph. An_asterisk_ indicates statistical significance (p ≤ 0.05; Student’s _t_test). These results indicate that PKC phosphorylation and membrane depolarization affect PKA modulation of Na+ current by parallel mechanisms that both enhance the PKA-dependent reduction in peak Na+ current.
Similar articles
- Dopaminergic modulation of voltage-gated Na+ current in rat hippocampal neurons requires anchoring of cAMP-dependent protein kinase.
Cantrell AR, Tibbs VC, Westenbroek RE, Scheuer T, Catterall WA. Cantrell AR, et al. J Neurosci. 1999 Sep 1;19(17):RC21. doi: 10.1523/JNEUROSCI.19-17-j0003.1999. J Neurosci. 1999. PMID: 10460275 Free PMC article. - Molecular mechanism of convergent regulation of brain Na(+) channels by protein kinase C and protein kinase A anchored to AKAP-15.
Cantrell AR, Tibbs VC, Yu FH, Murphy BJ, Sharp EM, Qu Y, Catterall WA, Scheuer T. Cantrell AR, et al. Mol Cell Neurosci. 2002 Sep;21(1):63-80. doi: 10.1006/mcne.2002.1162. Mol Cell Neurosci. 2002. PMID: 12359152 - Dopamine D1/D5 receptor activation modulates a persistent sodium current in rat prefrontal cortical neurons in vitro.
Gorelova NA, Yang CR. Gorelova NA, et al. J Neurophysiol. 2000 Jul;84(1):75-87. doi: 10.1152/jn.2000.84.1.75. J Neurophysiol. 2000. PMID: 10899185 - Molecular properties of brain sodium channels: an important target for anticonvulsant drugs.
Catterall WA. Catterall WA. Adv Neurol. 1999;79:441-56. Adv Neurol. 1999. PMID: 10514834 Review. - The role of D1 dopamine receptors and phospho-ERK in mediating cytotoxicity. Commentary.
Chen J, Sidhu A. Chen J, et al. Neurotox Res. 2005;7(3):179-81. doi: 10.1007/BF03036447. Neurotox Res. 2005. PMID: 15897152 Review.
Cited by
- Dopaminergic modulation of the voltage-gated sodium current in the cochlear afferent neurons of the rat.
Valdés-Baizabal C, Soto E, Vega R. Valdés-Baizabal C, et al. PLoS One. 2015 Mar 13;10(3):e0120808. doi: 10.1371/journal.pone.0120808. eCollection 2015. PLoS One. 2015. PMID: 25768433 Free PMC article. - Dopamine D1 receptor activation regulates sodium channel-dependent EPSP amplification in rat prefrontal cortex pyramidal neurons.
Rotaru DC, Lewis DA, Gonzalez-Burgos G. Rotaru DC, et al. J Physiol. 2007 Jun 15;581(Pt 3):981-1000. doi: 10.1113/jphysiol.2007.130864. Epub 2007 Mar 29. J Physiol. 2007. PMID: 17395630 Free PMC article. - Regulation of neuronal ion channels via P2Y receptors.
Lechner SG, Boehm S. Lechner SG, et al. Purinergic Signal. 2004 Dec;1(1):31-41. doi: 10.1007/s11302-004-4746-3. Purinergic Signal. 2004. PMID: 18404398 Free PMC article. - Strong G-Protein-Mediated Inhibition of Sodium Channels.
Mattheisen GB, Tsintsadze T, Smith SM. Mattheisen GB, et al. Cell Rep. 2018 May 29;23(9):2770-2781. doi: 10.1016/j.celrep.2018.04.109. Cell Rep. 2018. PMID: 29847805 Free PMC article. - Dopamine and full-field illumination activate D1 and D2-D5-type receptors in adult rat retinal ganglion cells.
Ogata G, Stradleigh TW, Partida GJ, Ishida AT. Ogata G, et al. J Comp Neurol. 2012 Dec 1;520(17):4032-49. doi: 10.1002/cne.23159. J Comp Neurol. 2012. PMID: 22678972 Free PMC article.
References
- Cantrell AR, Ma JY, Scheuer T, Catterall WA. Muscarinic modulation of sodium current by activation of protein kinase C in rat hippocampal neurons. Neuron. 1996;16:1019–1026. - PubMed
- Civelli O, Bunzow JR, Grandy DK. Molecular diversity of the dopamine receptors. Annu Rev Pharmacol Toxicol. 1993;32:281–307. - PubMed
Publication types
MeSH terms
Substances
LinkOut - more resources
Full Text Sources


