Characterization of lipid bilayer phases by confocal microscopy and fluorescence correlation spectroscopy - PubMed (original) (raw)
Characterization of lipid bilayer phases by confocal microscopy and fluorescence correlation spectroscopy
J Korlach et al. Proc Natl Acad Sci U S A. 1999.
Erratum in
- Proc Natl Acad Sci U S A 1999 Aug 17;96(17):9666
Abstract
We report the application of confocal imaging and fluorescence correlation spectroscopy (FCS) to characterize chemically well-defined lipid bilayer models for biomembranes. Giant unilamellar vesicles of dilauroyl phosphatidylcholine/dipalmitoyl phosphatidylcholine (DLPC/DPPC)/cholesterol were imaged by confocal fluorescence microscopy with two fluorescent probes, 1, 1'-dieicosanyl-3,3,3',3'-tetramethylindocarbocyanine perchlorate (DiI-C(20)) and 2-(4,4-difluoro-5,7-dimethyl-4-bora-3a, 4a-diaza-s-indacene-3-pentanoyl)-1-hexadecanoyl-sn-glycero-3 -phosphoc holine (Bodipy-PC). Phase separation was visualized by differential probe partition into the coexisting phases. Three-dimensional image reconstructions of confocal z-scans through giant unilamellar vesicles reveal the anisotropic morphology of coexisting phase domains on the surface of these vesicles with full two-dimensional resolution. This method demonstrates by direct visualization the exact superposition of like phase domains in apposing monolayers, thus answering a long-standing open question. Cholesterol was found to induce a marked change in the phase boundary shapes of the coexisting phase domains. To further characterize the phases, the translational diffusion coefficient, D(T), of the DiI-C(20) was measured by FCS. D(T) values at approximately 25 degrees C ranged from approximately 3 x 10(-8) cm(2)/s in the fluid phase, to approximately 2 x 10(-9) cm(2)/s in high-cholesterol-content phases, to approximately 2 x 10(-10) cm(2)/s in the spatially ordered phases that coexist with fluid phases. In favorable cases, FCS could distinguish two different values of D(T) in a region of two-phase coexistence on a single vesicle.
Figures
Figure 1
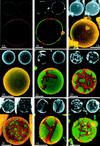
The principle of lipid phase identification, showing confocal images at the equator of GUVs at a phospholipid/cholesterol composition yielding (1A) a single fluid phase (DLPC/DPPC = 1/0), and (1B) ordered-fluid two-phase coexistence (DLPC/DPPC = 0.60/0.40). In each figure, DiI-C20 fluorescence is shown in the upper left small image and Bodipy-PC fluorescence in the upper right. Thus, the merged large lower image shows spatially ordered phase regions in red (DiI-C20 fluorescence) and fluid phase in green (Bodipy-PC fluorescence). The asphericity of these GUVs indicates lack of osmotic stress. A small adherent vesicle is visible in 1B and in several subsequent images. (Bars = 10 μm.) (2A–2E) Visualization of phase separation in the binary lipid mixture of DLPC/DPPC. The images show a progression of increasing DPPC concentration relative to DLPC at DLPC/DPPC values: 1/0 (2A), 0.80/0.20 (2B), 0.60/0.40 (2C), 0.40/0.60 (2D), and 0.20/0.80 (2E). Note that the vesicle shown in 2D is not unilamellar, but instead consists of two bilayers which are very close to each other. Image 2D shows two concentric GUVs, chosen to demonstrate the principle of superposition of phase domains in apposing monolayers (see text). No GUVs were formed in pure DPPC; apparently some fluid phase must be present for successful preparations of GUVs by this method. The circular rings of contrast in these and subsequent images are due to nonuniform axial stepping between confocal images and do not indicate compositional inhomogeneities. (Bars = 10 μm.) (3A and 3B) Influence of cholesterol on the two-phase region. GUVs at a constant ratio of DLPC/DPPC = 0.50/0.50 were prepared with increasing cholesterol concentrations of 0 (3A) and 5 mol % (3B). For cholesterol ≥10 mol %, images were identical in appearance to 2A and 2B. For explanation, see text. (Bars = 10 μm.)
Figure 2
Diffusion properties in laterally ordered and fluid phases in the absence of cholesterol, corresponding to Fig. 2. FCS autocorrelation curves were obtained for samples of composition DLPC/DPPC (□ = 1/0, ○ = 0.60/0.40, and ▵ = 0.20/0.80). Solid curves are data-fitting curves for diffusion theory from which _D_T values were determined. In this and all subsequent figures, correlation amplitudes are normalized to 1 by multiplying G(τ) with the average number of fluorescent molecules in the focal area 〈_N_〉 to compare the shapes of the curves for different compositions.
Figure 3
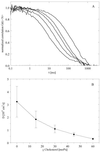
The binary lipid mixture DLPC/cholesterol exhibits a continuous change in diffusion coefficient. (A) Autocorrelation curves at increasing cholesterol concentration are shown (from left to right) for the compositions of DLPC with 0, 15, 30, 45, and 60 mol % cholesterol. Each autocorrelation curve represents the average of five separate vesicles measured. (B) Average diffusion coefficients determined from the autocorrelation curves in A. The error bars correspond to the entire range of diffusion coefficients obtained from the individual FCS measurements.
Figure 4
FCS autocorrelation curves corresponding to the cholesterol compositions shown in Fig. 3, at constant DLPC/DPPC = 0.50/0.50. Cholesterol concentrations: red indicates 0, green indicates 5, blue indicates 10, and black indicates 15 mol %. For explanation, see text.
Similar articles
- Fluorescent probe partitioning in giant unilamellar vesicles of 'lipid raft' mixtures.
Juhasz J, Davis JH, Sharom FJ. Juhasz J, et al. Biochem J. 2010 Sep 15;430(3):415-23. doi: 10.1042/BJ20100516. Biochem J. 2010. PMID: 20642452 - A correlation between lipid domain shape and binary phospholipid mixture composition in free standing bilayers: A two-photon fluorescence microscopy study.
Bagatolli LA, Gratton E. Bagatolli LA, et al. Biophys J. 2000 Jul;79(1):434-47. doi: 10.1016/S0006-3495(00)76305-3. Biophys J. 2000. PMID: 10866969 Free PMC article. - Detection of motional heterogeneities in lipid bilayer membranes by dual probe fluorescence correlation spectroscopy.
Korlach J, Baumgart T, Webb WW, Feigenson GW. Korlach J, et al. Biochim Biophys Acta. 2005 Mar 1;1668(2):158-63. doi: 10.1016/j.bbamem.2004.11.016. Epub 2005 Jan 19. Biochim Biophys Acta. 2005. PMID: 15737326 - Atomistic Picture of Fluorescent Probes with Hydrocarbon Tails in Lipid Bilayer Membranes: An Investigation of Selective Affinities and Fluorescent Anisotropies in Different Environmental Phases.
Knippenberg S, Fabre G, Osella S, Di Meo F, Paloncýová M, Ameloot M, Trouillas P. Knippenberg S, et al. Langmuir. 2018 Jul 31;34(30):9072-9084. doi: 10.1021/acs.langmuir.8b01164. Epub 2018 Jul 19. Langmuir. 2018. PMID: 29983063 - Recent developments in fluorescence correlation spectroscopy for diffusion measurements in planar lipid membranes.
Macháň R, Hof M. Macháň R, et al. Int J Mol Sci. 2010 Jan 28;11(2):427-457. doi: 10.3390/ijms11020427. Int J Mol Sci. 2010. PMID: 20386647 Free PMC article. Review.
Cited by
- There Is No Simple Model of the Plasma Membrane Organization.
Bernardino de la Serna J, Schütz GJ, Eggeling C, Cebecauer M. Bernardino de la Serna J, et al. Front Cell Dev Biol. 2016 Sep 29;4:106. doi: 10.3389/fcell.2016.00106. eCollection 2016. Front Cell Dev Biol. 2016. PMID: 27747212 Free PMC article. Review. - Controlling and measuring local composition and properties in lipid bilayer membranes.
D'Onofrio TG, Binns CW, Muth EH, Keating CD, Weiss PS. D'Onofrio TG, et al. J Biol Phys. 2002 Dec;28(4):605-17. doi: 10.1023/A:1021278420558. J Biol Phys. 2002. PMID: 23345801 Free PMC article. - The MAL Protein, an Integral Component of Specialized Membranes, in Normal Cells and Cancer.
Rubio-Ramos A, Labat-de-Hoz L, Correas I, Alonso MA. Rubio-Ramos A, et al. Cells. 2021 Apr 30;10(5):1065. doi: 10.3390/cells10051065. Cells. 2021. PMID: 33946345 Free PMC article. Review. - Fluorescence lifetime imaging of membrane lipid order with a ratiometric fluorescent probe.
Kilin V, Glushonkov O, Herdly L, Klymchenko A, Richert L, Mely Y. Kilin V, et al. Biophys J. 2015 May 19;108(10):2521-2531. doi: 10.1016/j.bpj.2015.04.003. Biophys J. 2015. PMID: 25992730 Free PMC article. - Zero mode waveguides for single-molecule spectroscopy on lipid membranes.
Samiee KT, Moran-Mirabal JM, Cheung YK, Craighead HG. Samiee KT, et al. Biophys J. 2006 May 1;90(9):3288-99. doi: 10.1529/biophysj.105.072819. Epub 2006 Feb 3. Biophys J. 2006. PMID: 16461393 Free PMC article.
References
- Simons K, Ikonen E. Nature (London) 1997;387:569–572. - PubMed
- Edidin M. Curr Opin Struct Biol. 1997;7:528–532. - PubMed
- Brown D A, London E. Biochem Biophys Res Commun. 1997;240:1–7. - PubMed
- Silvius J R, del Giudice D, Lafleur M. Biochemistry. 1996;35:15198–15208. - PubMed
Publication types
MeSH terms
Substances
LinkOut - more resources
Full Text Sources
Other Literature Sources


