Two actions of calcium regulate the supply of releasable vesicles at the ribbon synapse of retinal bipolar cells - PubMed (original) (raw)
Two actions of calcium regulate the supply of releasable vesicles at the ribbon synapse of retinal bipolar cells
A Gomis et al. J Neurosci. 1999.
Abstract
Ribbon synapses of sensory neurons are able to sustain high rates of exocytosis in response to maintained depolarization, but it is not known how this is achieved. Using the capacitance technique, we have found that Ca(2+) regulates the supply of releasable vesicles at the ribbon synapse of depolarizing bipolar cells from the retina of goldfish. Ca(2+) had two actions that could be differentiated by introduction of the Ca(2+) chelator EGTA; one action stimulated refilling of the rapidly releasable pool of vesicles from a reserve pool, and a second action stimulated recruitment of vesicles to the reserve pool. The capacity of the reserve pool was approximately 3500 vesicles, which is similar to the number that can attach to the ribbons. These results suggest that continuous exocytosis at ribbon synapses is maintained by the Ca(2+)-dependent translocation of vesicles from the cytoplasm, through the ribbon, to release sites on the plasma membrane.
Figures
Fig. 1.
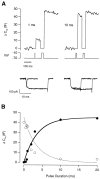
Measuring the rapidly releasable pool of vesicles.A, Capacitance increases elicited by a double-pulse protocol. The first depolarization from −70 to −10 mV lasted 1 msec in the example on the left and 10 msec in the example on the right. In each case, the second stimulus was a 20 msec depolarization, delivered after a delay of 100 msec, to release the remainder of the RRP (the emptying stimulus). The rest period between stimulation episodes was 1–3 min. The size of the RRP at the beginning of each stimulus episode was equivalent to a total response of ∼45 fF. The Ca2+ currents are shown below.B, The capacitance increase elicited by the first stimulus plotted as a function of its duration (filled circles). The bold line through the_points_ is a saturating exponential with a time constant of 3.6 msec and a maximum amplitude of 45 fF. The open circles plot the capacitance increase elicited by the emptying stimulus. The dashed line is a mirror image of the_bold line_ (see Results).
Fig. 2.
Refilling of the RRP after complete depletion by a 20 msec stimulus. A, The capacitance response to two 20 msec depolarizations is shown for intervals of 100 msec (left), 3 sec (middle), and 40 sec (right). In each case, the stimulus was a depolarization from −70 to 0 mV. The inset in the left panel is a superimposition of the Ca2+currents elicited by two stimuli (calibration: 20 msec, 200 pA). Currents were leak subtracted using a single leak pulse (a 20 mV depolarization from −70 mV). B, The time course of refilling of the RRP measured from the type of experiment shown in_A_. The amplitude of the second response is expressed as a percentage of the first for various intervals. The_line_ fitted through the points is a double-exponential, with 30% of sites refilled with a time constant of 0.64 sec and the remainder with a time constant of 31 sec. The number of observations for each interval are as follows: 100 msec, 7; 250 msec, 1; 500 msec, 24; 1 sec, 14; 2 sec, 13; 5 sec, 20; 10 sec, 10; 20 sec, 4; 30 sec, 3; 40 sec, 3; 60 sec, 3.
Fig. 3.
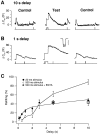
Refilling of the RRP after a long stimulus.A, Recovery of the capacitance response 10 sec after a 20 msec depolarization (Control) is compared with that measured 10 sec after a 500 msec depolarization (Test). Note that in the Test protocol, the 500 msec stimulus was preceded by a 20 msec depolarization to measure the initial size of the RRP. In this terminal, the RRP recovered 91% of its initial size 10 sec after a 500 msec depolarization but only 44% in the controls immediately before and after. B, Recovery of the capacitance response 1 sec after a 20 msec depolarization is compared with that measured 1 sec after a 500 msec depolarization. In this terminal, the RRP did not exhibit any measurable recovery 1 sec after the 500 msec stimulus but recovered 17% in the control immediately before and 21% in the one after. The inset in the middle panel is a superimposition of the Ca2+ currents elicited by the two emptying stimuli (calibration: 20 msec, 200 pA). C, The time course of refilling of the RRP measured from the type of experiment shown in A and B. The_open circles_ show refilling measured after a 500 msec depolarization; the amplitude of the response to the second depleting stimulus is expressed as a percentage of the first for various intervals. The open squares show results obtained in terminals loaded with EGTA (see Results and Fig. 5). The closed circles provide a comparison with the results in Figure2_B_, showing refilling measured after a 20 msec depolarization.
Fig. 4.
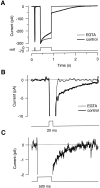
The rise in cytoplasmic [Ca2+] was reduced in terminals loaded with EGTA.A, A comparison of the currents elicited by a 20 and 500 msec depolarization from −70 to 0 mV in a terminal with endogenous Ca2+ buffers (bold line) and a terminal additionally loaded with EGTA (thin line). These terminals were used for this comparison because the Ca2+ currents were of similar amplitude. EGTA blocked the Ca2+-activated tail current that decayed slowly after the 500 msec stimulus. The latter part of the decay in the tail current occurred with a time constant of 0.51 sec in the control.B, The tail currents after the 20 msec stimuli shown on expanded scales. The bold line fitted to the control_trace_ has a time constant of 0.11 sec. C, EGTA did not completely block the Ca2+-activated tail current after a 500 msec stimulus; expansion of_trace_ in A. The _bold line_fitted to the trace has a time constant of 0.43 sec.
Fig. 5.
EGTA inhibited the second phase of exocytosis and the acceleration of refilling caused by a prolonged stimulus.A, Recovery of the capacitance response after a 500 msec depolarization is compared in a terminal with endogenous Ca2+ buffers (left) and a terminal additionally loaded with EGTA (right). In each case, the size of the RRP was measured after a delay of 10 sec. EGTA had two effects: a 500 msec depolarization caused less exocytosis, and recovery of the RRP was reduced. B, EGTA caused a small reduction in the capacitance response to the emptying stimulus. Only the first response in each terminal was used for this comparison because EGTA inhibited refilling of the RRP over the long term (see Results).C, EGTA inhibited exocytosis from the second pool of vesicles. The capacitance response to a 500 msec depolarization is shown relative to the response to the emptying stimulus delivered 200 msec before. All measurements were made from terminals in which these were the first stimuli.
Fig. 6.
EGTA inhibited refilling of a reserve pool of vesicles. A, Capacitance responses during a train of emptying stimuli (20 msec depolarizations to 0 mV) delivered at a frequency of 0.1 Hz. The top is from a control terminal, and the bottom is from a terminal loaded with EGTA. The figures below the responses indicate the stimulus number in the train.B, Averaged results from the type of experiment shown in_A_. The capacitance responses during the stimulus train are plotted relative to the first response, which averaged 50 fF in control terminals (n = 18; closed symbols) and 33 fF in terminals loaded with EGTA (n = 16; open symbols). In control terminals, the second response was 45% of the first, and subsequent responses were not significantly different. In terminals loaded with EGTA, the response to the emptying stimulus gradually declined to zero.C, The accumulated amount of exocytosis averaged from the type of experiment shown in A. In control terminals, refilling of the RRP occurred at a constant average rate, as indicated by the solid line. In terminals loaded with EGTA, the maximum number of vesicles that could be transferred to the RRP was 2.7 times its initial size, as indicated by the dashed line.
Fig. 7.
The effects of EGTA were partially overcome by introduction of a large Ca2+ load. Capacitance response from a terminal loaded with EGTA, after complete depletion of both the RRP and reserve pool by a train of stimuli. Before this stimulation episode, the terminal was at rest for 150 sec. The first emptying stimulus elicited a negligible response. A 500 msec depolarization stimulated exocytosis and caused the RRP to refill, as demonstrated by the much larger response to the second emptying stimulus.
Fig. 8.
Vesicle pools in the synaptic terminal of depolarizing bipolar cells. Evidence for this model is summarized in Discussion. The numbers in_parentheses_ indicate the rates of the vesicle transport when the Ca2+ current is maximally activated.
Similar articles
- Synaptic depression and the kinetics of exocytosis in retinal bipolar cells.
Burrone J, Lagnado L. Burrone J, et al. J Neurosci. 2000 Jan 15;20(2):568-78. doi: 10.1523/JNEUROSCI.20-02-00568.2000. J Neurosci. 2000. PMID: 10632586 Free PMC article. - Endogenous calcium buffers regulate fast exocytosis in the synaptic terminal of retinal bipolar cells.
Burrone J, Neves G, Gomis A, Cooke A, Lagnado L. Burrone J, et al. Neuron. 2002 Jan 3;33(1):101-12. doi: 10.1016/s0896-6273(01)00565-7. Neuron. 2002. PMID: 11779483 - High mobility of vesicles supports continuous exocytosis at a ribbon synapse.
Holt M, Cooke A, Neef A, Lagnado L. Holt M, et al. Curr Biol. 2004 Feb 3;14(3):173-83. doi: 10.1016/j.cub.2003.12.053. Curr Biol. 2004. PMID: 14761649 - Electrophysiology of synaptic vesicle cycling.
von Gersdorff H, Matthews G. von Gersdorff H, et al. Annu Rev Physiol. 1999;61:725-52. doi: 10.1146/annurev.physiol.61.1.725. Annu Rev Physiol. 1999. PMID: 10099708 Review. - Neurotransmitter release at ribbon synapses in the retina.
Morgans CW. Morgans CW. Immunol Cell Biol. 2000 Aug;78(4):442-6. doi: 10.1046/j.1440-1711.2000.00923.x. Immunol Cell Biol. 2000. PMID: 10947871 Review.
Cited by
- Direct Observation of Vesicle Transport on the Synaptic Ribbon Provides Evidence That Vesicles Are Mobilized and Prepared Rapidly for Release.
Joselevitch C, Zenisek D. Joselevitch C, et al. J Neurosci. 2020 Sep 23;40(39):7390-7404. doi: 10.1523/JNEUROSCI.0605-20.2020. Epub 2020 Aug 26. J Neurosci. 2020. PMID: 32847965 Free PMC article. - Synaptotagmin-7 places dense-core vesicles at the cell membrane to promote Munc13-2- and Ca2+-dependent priming.
Tawfik B, Martins JS, Houy S, Imig C, Pinheiro PS, Wojcik SM, Brose N, Cooper BH, Sørensen JB. Tawfik B, et al. Elife. 2021 Mar 22;10:e64527. doi: 10.7554/eLife.64527. Elife. 2021. PMID: 33749593 Free PMC article. - Calcium influx selects the fast mode of endocytosis in the synaptic terminal of retinal bipolar cells.
Neves G, Gomis A, Lagnado L. Neves G, et al. Proc Natl Acad Sci U S A. 2001 Dec 18;98(26):15282-7. doi: 10.1073/pnas.261311698. Epub 2001 Dec 4. Proc Natl Acad Sci U S A. 2001. PMID: 11734626 Free PMC article. - Calcium-induced calcium release supports recruitment of synaptic vesicles in auditory hair cells.
Castellano-Muñoz M, Schnee ME, Ricci AJ. Castellano-Muñoz M, et al. J Neurophysiol. 2016 Jan 1;115(1):226-39. doi: 10.1152/jn.00559.2015. Epub 2015 Oct 28. J Neurophysiol. 2016. PMID: 26510758 Free PMC article. - Modeling and measurement of vesicle pools at the cone ribbon synapse: Changes in release probability are solely responsible for voltage-dependent changes in release.
Thoreson WB, Van Hook MJ, Parmelee C, Curto C. Thoreson WB, et al. Synapse. 2016 Jan;70(1):1-14. doi: 10.1002/syn.21871. Epub 2015 Nov 6. Synapse. 2016. PMID: 26541100 Free PMC article.
References
- Burns ME, Augustine GJ. Synaptic structure and function: dynamic organization yields architectural precision. Cell. 1995;83:187–194. - PubMed
Publication types
MeSH terms
Substances
LinkOut - more resources
Full Text Sources
Miscellaneous


