Major peptide autoepitopes for nucleosome-specific T cells of human lupus - PubMed (original) (raw)
Major peptide autoepitopes for nucleosome-specific T cells of human lupus
L Lu et al. J Clin Invest. 1999 Aug.
Abstract
We tested 154 peptides spanning the entire length of core histones of nucleosomes for the ability to stimulate an anti-DNA autoantibody-inducing T helper (Th) clone, as well as CD4(+) T-cell lines and T cells, in fresh PBMCs from 23 patients with lupus erythematosus. In contrast to normal T cells, lupus T cells responded strongly to certain histone peptides, irrespective of the patient's disease status. Nucleosomal peptides in histone regions H2B(10-33), H4(16-39) (and overlapping H4(14-28)), H4(71-94), and H3(91-105) (and overlapping H3(100-114)) were recurrently recognized by CD4 T cells from the patients with lupus. Remarkably, these same peptides overlap with major epitopes for the Th cells that induce anti-DNA autoantibodies and nephritis in lupus-prone mice. We localized 2 other recurrent epitopes for human lupus T cells in H2A(34-48) and H4(49-63). All the T-cell autoepitopes have multiple HLA-DR binding motifs, and the epitopes are located in histone regions recognized by lupus autoantibodies, suggesting a basis for their immunodominance. Native nucleosomes and their peptides H4(16-39), H4(71-94), and H3(91-105) induced a stronger IFN-gamma response, whereas others, particularly, H2A(34-48), favored an IL-10- and/or IL-4-positive T-cell response. The major autoepitopes may reveal the mechanism of autoimmune T-cell expansion and lead to antigen-specific therapy of human lupus.
Figures
Figure 1
IL-2 production by anti-DNA autoantibody–inducing T-cell clone DD2 in response to nucleosomal histone peptides (10 μM each) presented by autologous EBV B-cell APCs. Bars represent mean of triplicate values. Values higher than 3 SD (horizontal line) above the mean of background (DD2 + APCs without added peptide produced 132 pg/mL IL-2) were considered as stimulatory. IL-2 production by DD2 in response to anti-CD3 stimulation was 554 pg/mL.
Figure 2
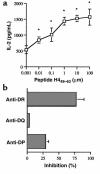
(a) IL-2 production by a representative short-term CD4 T-cell line L-EB, with different concentrations of histone H449–63 peptide-pulsed autologous EBV B-cell APCs. Stimulation with 0.01–100 μM peptide showed significant differences (*P < 0.05 at 0.01 μM, Student’s t test) from background (T cells plus APCs cultured without peptide). (b) An example of MHC class II–dependent recognition of nucleosomal peptides. Presentation of H449–63 peptide by autologous EBV B cells to short-term T-cell line L-EB was inhibited mainly by anti-DR mAb.
Figure 3
Example of a pepscan of L-SC, a short-term CD4 T-cell line from a patient with lupus, with histone peptides presented by autologous EBV B-cell APCs. The baseline for y axis is set at 3 SD above the mean of background values obtained with T cells cultured with APCs alone. IL-2 production responses to peptides above that value are shown.
Figure 4
IL-2 production by N-JV, a short-term CD4 T-cell line from a representative normal donor to histone peptides using autologous EBV B-cell APCs. The horizontal line in each panel demarcates 3 SD above the mean of background values. None of the normal T-cell lines showed a response to any of the peptides that was 3 SD above their respective background values.
Figure 5
Summary of IL-2 production responses of short-term T-cell lines to nucleosomal histone peptides in 10 patients with lupus. The results are expressed as percentages of maximal responses of the T-cell lines stimulated by anti-CD3 mAb. Bars represent mean values from 10 lupus T-cell lines, with error bars in SEM. Values of T cells cultured with autologous EBV B-cell APCs alone were considered as background. The baseline for y axis is set at 22%, which is 3 SD above the mean of background values (14.5%). A peptide was considered stimulatory when it elicited a positive response above this baseline. For instance, the average of responses of all 10 T-cell lines to H416–30 peptide was 23 ± 2.6. All the stimulatory peptides in the panels elicited positive responses in all 10 lupus T-cell lines to levels greater than 3 SD above their respective background values. The extreme right bar in the bottom right (H4) panel was the mean value of responses of the 10 lines to whole nucleosome preparation.
Figure 6
A library of histone peptides that correspond to the stimulatory epitope regions identified with lupus T-cell lines and clone DD2. In addition, three 24-mer peptides that overlapped some of these epitopes were used for further studies: H2B10–33 (PKKGSKKAVTKAQKKDGKKRKRSR), H416–39 (KRHRKVLRDNIQGITKPAIRRLAR), and H471–94 (TYTEHAKRKTVTAMDVVYALKRQG). All peptide sequences are identical to those in human histones (GenBank).
Figure 7
Representative 2-color intracellular cytokine staining of gated CD4+ T cells freshly obtained from 2 patients with lupus who were in remission (R-WG and R-SC). IFN-γ and IL-10 response (a) and IL-2 and IL-4 production (b) in response to stimulation by anti-CD3, nucleosomes, or the histone peptide epitopes. Demarcation of the quadrants was set based on background staining of the T cells cultured in medium alone. Percentage values for the respective cytokine stainings can be found in Figure 8.
Figure 8
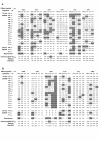
Flow cytometry results of intracellular cytokine staining of viable, CD4+-gated T cells from peripheral blood of all the patients with lupus. T-cell response to a peptide epitope was considered positive when the percentage of positive cells was twice the background (medium alone) and at least 0.2% of the total viable CD4+ T cells were stained positive. Positive response is shown in shaded and bold numbers. nd = not done.
Figure 9
Flow cytometry results of intracellular cytokine staining of CD4 T cells from all the normal subjects. A positive response is displayed, as in Figure 8. The normal T cells did not show a positive response to the longer (24-mer) peptides (data not shown).
Figure 10
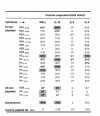
Frequency of positive responders to the histone autoepitopes among the patients with lupus shown in Figure 8. Bold and shaded numbers highlight when 50% or more responded to a particular epitope; bold and italics represent at least 40% responders. These epitopes were also recognized by T-cell lines and clones from other lupus patients (Figures 1–6). AAssays could not be done in all cases owing to lack of sufficient PBMCs. The responses of certain lupus T cells were poor, judging from their anti-CD3 response, and those are also excluded from the total.
Figure 11
Multiple HLA-DR binding motifs in histone autoepitopes. The autoepitopes that are recurrently recognized by human lupus T cells (Figure 10) were aligned to various HLA-DR motifs published previously (–50): HLA-DR1, DR4, DR7: [ LIVMF ] XXXX [ STPALIVMC]; [RKHLIY] XXXX [YTNQCDERSW] XXX AMVKWLHYIFP; [RKHLIY] XXX [YTNQCDERSW] XXX AMVKWLHYIFP. HLA-DR3: [FILVY] XX [DNQT]. HLA-DR8: [FIVLY] XXX [HKR]. Any single amino acid inside the brackets is one of the most probable anchor residues at that position of the motif. In each of the histone autoepitopes, the corresponding residues are highlighted by bold and underlined letters. X indicates that any of the 20 amino acids can be present in that position, and also represents an individual amino acid position in the sequence. In addition to the motifs indicated here, H471–94 contains multiple motifs for HLA-DR1,3,4,7,8 and also HLA-DR5.
Similar articles
- Nucleosomal peptide epitopes for nephritis-inducing T helper cells of murine lupus.
Kaliyaperumal A, Mohan C, Wu W, Datta SK. Kaliyaperumal A, et al. J Exp Med. 1996 Jun 1;183(6):2459-69. doi: 10.1084/jem.183.6.2459. J Exp Med. 1996. PMID: 8676066 Free PMC article. - Naturally processed chromatin peptides reveal a major autoepitope that primes pathogenic T and B cells of lupus.
Kaliyaperumal A, Michaels MA, Datta SK. Kaliyaperumal A, et al. J Immunol. 2002 Mar 1;168(5):2530-7. doi: 10.4049/jimmunol.168.5.2530. J Immunol. 2002. PMID: 11859148 - Major peptide autoepitopes for nucleosome-centered T and B cell interaction in human and murine lupus.
Datta SK. Datta SK. Ann N Y Acad Sci. 2003 Apr;987:79-90. doi: 10.1111/j.1749-6632.2003.tb06035.x. Ann N Y Acad Sci. 2003. PMID: 12727626 Review. - Anti-nucleosome antibodies and T-cell response in systemic lupus erythematosus.
Fournel S, Muller S. Fournel S, et al. Ann Med Interne (Paris). 2002 Dec;153(8):513-9. Ann Med Interne (Paris). 2002. PMID: 12610425 Review.
Cited by
- Characterization of self-T-cell response and antigenic determinants of U1A protein with bone marrow-derived dendritic cells in NZB x NZW F1 mice.
Suen JL, Wu CH, Chen YY, Wu WM, Chiang BL. Suen JL, et al. Immunology. 2001 Jul;103(3):301-9. doi: 10.1046/j.1365-2567.2001.01255.x. Immunology. 2001. PMID: 11454059 Free PMC article. - In silico Analyses of Skin and Peripheral Blood Transcriptional Data in Cutaneous Lupus Reveals CCR2-A Novel Potential Therapeutic Target.
Dey-Rao R, Sinha AA. Dey-Rao R, et al. Front Immunol. 2019 Mar 29;10:640. doi: 10.3389/fimmu.2019.00640. eCollection 2019. Front Immunol. 2019. PMID: 30984198 Free PMC article. - Developments in the scientific understanding of lupus.
Ardoin SP, Pisetsky DS. Ardoin SP, et al. Arthritis Res Ther. 2008;10(5):218. doi: 10.1186/ar2488. Epub 2008 Oct 10. Arthritis Res Ther. 2008. PMID: 18947369 Free PMC article. Review. - Functional heterogeneity of human skin-resident memory T cells in health and disease.
Strobl J, Haniffa M. Strobl J, et al. Immunol Rev. 2023 Jul;316(1):104-119. doi: 10.1111/imr.13213. Epub 2023 May 5. Immunol Rev. 2023. PMID: 37144705 Free PMC article. Review. - Analysis of the interindividual conservation of T cell receptor alpha- and beta-chain variable regions gene in the peripheral blood of patients with systemic lupus erythematosus.
Luo W, Ma L, Wen Q, Wang N, Zhou MQ, Wang XN. Luo W, et al. Clin Exp Immunol. 2008 Dec;154(3):316-24. doi: 10.1111/j.1365-2249.2008.03770.x. Epub 2008 Sep 22. Clin Exp Immunol. 2008. PMID: 18811695 Free PMC article.
References
- Shivakumar S, Tsokos GC, Datta SK. T cell receptor α/β expressing double negative (CD4–/CD8–) and CD4+ T helper cells in humans augment the production of pathogenic anti-DNA autoantibodies associated with lupus nephritis. J Immunol. 1989;143:103–112. - PubMed
- Sainis K, Datta SK. CD4+ T cell lines with selective patterns of autoreactivity as well as CD4–/CD8– T helper cell lines augment the production of idiotypes shared by pathogenic anti-DNA autoantibodies in the NZB × SWR model of lupus nephritis. J Immunol. 1988;140:2215–2224. - PubMed
Publication types
MeSH terms
Substances
Grants and funding
- AI41985/AI/NIAID NIH HHS/United States
- R01 AI041985/AI/NIAID NIH HHS/United States
- R01 AR039157/AR/NIAMS NIH HHS/United States
- AR46309/AR/NIAMS NIH HHS/United States
- R01-AR39157/AR/NIAMS NIH HHS/United States
LinkOut - more resources
Full Text Sources
Other Literature Sources
Medical
Molecular Biology Databases
Research Materials


