Molecular dynamics simulations of unfolding and refolding of a beta-hairpin fragment of protein G - PubMed (original) (raw)
Molecular dynamics simulations of unfolding and refolding of a beta-hairpin fragment of protein G
V S Pande et al. Proc Natl Acad Sci U S A. 1999.
Abstract
We have studied the unfolding and refolding pathway of a beta-hairpin fragment of protein G by using molecular dynamics. Although this fragment is small, it possesses several of the qualities ascribed to small proteins: cooperatively formed beta-sheet secondary structure and a hydrophobic "core" of packed side chains. At high temperatures, we find that the beta-hairpin unfolds through a series of sudden, discrete conformational changes. These changes occur between states that are identified with the folded state, a pair of partially unfolded kinetic intermediates, and the unfolded state. To study refolding at low temperatures, we perform a series of short simulations starting from the transition states of the discrete transitions determined by the unfolding simulations.
Figures
Figure 1
A typical unfolding trajectory at 400 K demonstrates discrete unfolding steps. _β_-sheet hydrogen bonds (if formed) are shown as sheets, and the hydrophobic core is shown in wire frame with van der Waals radii (Trp red, Phe blue, Tyr purple, Val gray). The time in ps is given in the upper left of each frame.
Figure 2
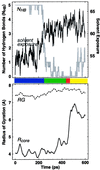
Quantitative characterization of the 400-K trajectory shown in Fig. 1. Both the number of hydrogen bonds (_N_HB; see Methods) and the “solvent exposure” (the number of protein atoms within 3.0 Å of a solvent atom; our results did not change qualitatively for values ranging from 1.5 to 4.5 Å) sharply change around 250 ps, signaling the F → H transition. Because _N_HB does not discriminate between the H, S, and U states, these transitions can be studied by using the core radius of gyration _R_core. A sharp transition in _R_core signal the H → S transition around 450 ps, which is followed rapidly by the S → U transition around 475 ps. The radius of gyration _R_G of all the α-carbons typically does not exhibit any features near these transitions. The plots shown are results of box car averaging over a 10-ps window for _R_G and _R_core and a 2-ps window otherwise. General features are insensitive to the nature of this averaging.
Figure 3
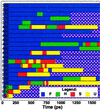
Summary of the 22 unfolding trajectories. The color denotes the state (F blue, H green, S red, and U yellow). See Fig. 4 caption for details of the classification of conformations into these four states. The 400-K trajectory used in Figs. 1 and 2 is the first 400-K trajectory in this chart.
Figure 4
Probability distribution of conformations sampled from six 400-K unfolding trajectories, plotted vs. number of hydrogen bonds (_N_HB) and core radius of gyration (_R_core). The four distinct maxima correspond to the states F, H, S, and U. States were chosen to correspond to the probability maxima in the cumulative probability distribution shown here. For Fig. 3, the U, S, and H states were discriminated from each other by the core radius of gyration _R_core:U if _R_core > 7 Å; S if 6 Å ≤ _R_core ≤ 7 Å; H if _R_core < 6 Å and less then six native contacts (equivalent to three native hydrogen bonds); and F if _R_core < 6 Å and greater than or equal to six native contacts (equivalent to _N_HB ≥ 4).
Figure 5
Dwell time within a state vs. transit time between states. We consider the fluctuations of a dynamical quantity x(t) over the course of an unfolding trajectory. Here x can be either the number of hydrogen bonds (_N_HB) or the core radius of gyration (R_core). The correlation function g(τ;X) ≡ 〈[x(t + τ) − x(t)]2〉_x(t)=X measures the mean square variation of x over a time interval τ, given that x took the value X at the start of the interval. The average is taken over all six 400-K simulations (total time = 10.2 ns). For X in the vicinity of a metastable free energy minimum, fluctuations in x(t) will remain small during the characteristic lifetime of the state. For X near a free energy barrier, however, fluctuations in x will grow rapidly as the polymer quickly moves into one of the adjacent free energy minima. From this correlation function we can extract (a) the location of the metastable states, (b) the characteristic dwell-time within a state (typically 100 ps at 400 K), and (c) the characteristic transit time across free energy barriers (typically 10–20 ps at 400 K).
Figure 6
The transition probability P calculated at 300 K vs. time along the 400-K trajectory shown in Figs. 1 and 2 for the (Left) F ⇌ H and (Right) S ⇌ U transitions for conformations in the transition region. The solid line is the order parameter used to discriminate states, i.e., (Left) hydrogen bonds _N_HB and (Right) core size _R_core. The dashed line is a fit to P = (erf[(_t_-_t_TS)/_t_trans]+1)/2, where t is time, _t_0 is the time at which P = 1/2 (that is, near the TS) and _t_trans is the duration of the transition region. We see that _P_F⇌H(C) and P S_⇌_U(C) change sharply from 0 to 1 over a few ps time interval (with ttrans = 7.0 and 1.3 ps, respectively, at 400 K). Transition probabilities for this 400-K run calculated at 400 K are indistinguishable within error from the 300-K probabilities presented here.
Similar articles
- Molecular dynamics simulations of a beta-hairpin fragment of protein G: balance between side-chain and backbone forces.
Ma B, Nussinov R. Ma B, et al. J Mol Biol. 2000 Mar 3;296(4):1091-104. doi: 10.1006/jmbi.2000.3518. J Mol Biol. 2000. PMID: 10686106 - Understanding beta-hairpin formation by molecular dynamics simulations of unfolding.
Lee J, Shin S. Lee J, et al. Biophys J. 2001 Nov;81(5):2507-16. doi: 10.1016/S0006-3495(01)75896-1. Biophys J. 2001. PMID: 11606266 Free PMC article. - Towards a complete description of the structural and dynamic properties of the denatured state of barnase and the role of residual structure in folding.
Wong KB, Clarke J, Bond CJ, Neira JL, Freund SM, Fersht AR, Daggett V. Wong KB, et al. J Mol Biol. 2000 Mar 10;296(5):1257-82. doi: 10.1006/jmbi.2000.3523. J Mol Biol. 2000. PMID: 10698632 - Mechanical unfolding of a beta-hairpin using molecular dynamics.
Bryant Z, Pande VS, Rokhsar DS. Bryant Z, et al. Biophys J. 2000 Feb;78(2):584-9. doi: 10.1016/S0006-3495(00)76618-5. Biophys J. 2000. PMID: 10653773 Free PMC article.
Cited by
- Molecular Dynamics Driven Design of pH-Stabilized Mutants of MNEI, a Sweet Protein.
Leone S, Picone D. Leone S, et al. PLoS One. 2016 Jun 24;11(6):e0158372. doi: 10.1371/journal.pone.0158372. eCollection 2016. PLoS One. 2016. PMID: 27340829 Free PMC article. - Folding simulations of a three-stranded antiparallel beta -sheet peptide.
Ferrara P, Caflisch A. Ferrara P, et al. Proc Natl Acad Sci U S A. 2000 Sep 26;97(20):10780-5. doi: 10.1073/pnas.190324897. Proc Natl Acad Sci U S A. 2000. PMID: 10984515 Free PMC article. - RNA hairpin-folding kinetics.
Zhang W, Chen SJ. Zhang W, et al. Proc Natl Acad Sci U S A. 2002 Feb 19;99(4):1931-6. doi: 10.1073/pnas.032443099. Epub 2002 Feb 12. Proc Natl Acad Sci U S A. 2002. PMID: 11842187 Free PMC article. - Thermodynamics of alpha- and beta-structure formation in proteins.
Irbäck A, Samuelsson B, Sjunnesson F, Wallin S. Irbäck A, et al. Biophys J. 2003 Sep;85(3):1466-73. doi: 10.1016/S0006-3495(03)74579-2. Biophys J. 2003. PMID: 12944264 Free PMC article. - Multifunnel Energy Landscapes for Phosphorylated Translation Repressor 4E-BP2 and Its Mutants.
Kang W, Jiang F, Wu YD, Wales DJ. Kang W, et al. J Chem Theory Comput. 2020 Jan 14;16(1):800-810. doi: 10.1021/acs.jctc.9b01042. Epub 2019 Dec 11. J Chem Theory Comput. 2020. PMID: 31774674 Free PMC article.
References
- Daggett V, Levitt M. J Mol Biol. 1993;232:600–619. - PubMed
- Alonso D O, Daggett V. J Mol Biol. 1995;247:501–520. - PubMed
- Van Gunsteren W F, Hunenberger P H, Kovacs H, Mark A E, Schiffer C A. Philos Trans R Soc London B. 1995;348:49–59. - PubMed
- Tirado-Rives J, Orozco M, Jorgenseon W L. Biochemistry. 1997;36:7313–7329. - PubMed
Publication types
MeSH terms
Substances
LinkOut - more resources
Full Text Sources
Other Literature Sources


