Passage through stationary phase advances replicative aging in Saccharomyces cerevisiae - PubMed (original) (raw)
Passage through stationary phase advances replicative aging in Saccharomyces cerevisiae
K Ashrafi et al. Proc Natl Acad Sci U S A. 1999.
Abstract
Saccharomyces cerevisiae mother cells undergo an aging program that includes morphologic changes, sterility, redistribution of the Sir transcriptional silencing complex from HM loci and telomeres to the nucleolus, alterations in nucleolar architecture, and accumulation of extrachromosomal ribosomal DNA circles (ERCs). We report here that cells starved for nutrients during prolonged periods in stationary phase show a decrease in generational lifespan when they reenter the cell cycle. This shortened lifespan is not transmitted to progeny cells, indicating that it is not due to irreversible genetic damage. The decrease in the lifespan is accompanied by all of the changes of accelerated aging with the notable exception that ERC accumulation is not augmented compared with generation-matched, nonstarved cells. These results suggest a number of models, including one in which starvation reveals a component of aging that works in parallel with the accumulation of ERCs. Stationary-phase yeast cells may be a useful system for identifying factors that affect aging in other nondividing eukaryotic cells.
Figures
Figure 1
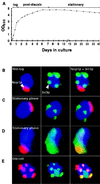
Stationary-phase cells do not resemble replicatively aging mother cells. (A) Growth curve in YPD at 24°C. (B) Multilabel immunohistochemical study of cells harvested at mid-logarithmic phase. Nop1p (fibrillarin) appears red and marks the nucleolus. Sir3p is stained green and is located outside the nucleolus and is telomeric. DNA is stained blue with DAPI. (C) Typical cells (80–85% of the population) present in 3-week-old stationary-phase cultures. Sir3p is present at telomeres. The nucleolus is crescent shaped and intact. (D) Representative of a subpopulation of cells present in a 3-week-old stationary-phase culture. Sir3p is redistributed throughout the nucleus, including the nucleolus (yellow). Staining patterns shown in B_–_D were scored in several hundred cells per aliquot per time point per experiment (n = 2 independent experiments). (E) Old cell recovered from a nonstarved culture by sorting (see Materials and Methods). The average bud scar count of the preparation was 15.5 ± 3.3. There is nucleolar fragmentation and redistribution of Sir3p to these fragments.
Figure 2
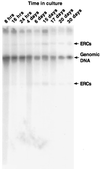
ERCs do not accumulate with increasing time spent in stationary phase. Total cellular DNA was prepared from cultures harvested at various times after incubation at 24°C in YPD, and probed with [32P]rDNA. The arrows indicate the positions of migration of ERCs and genomic DNA.
Figure 3
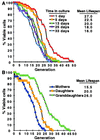
Passage through stationary phase results in a shortened lifespan when cells are reexposed to nutrients. (A) Lifespans of cells recovered from cultures after the indicated incubation times in YPD (n = 37–51 mothers scored per group). The mean lifespans for each group (defined as the generation where 50% of mothers are still dividing) are noted. (B) Mothers refer to viable cells recovered after 3 weeks in stationary phase. Daughters and granddaughters were obtained from a cohort of 44 mothers and 39 daughters, respectively. The difference in mean lifespans between mothers, daughters, and granddaughters is statistically significant as judged by the nonparametric Wilcoxon signed rank test.
Figure 4
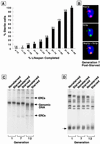
The reduced lifespan of cells with prior stationary phase experience is accompanied by sterility and nucleolar changes but not more rapid ERC accumulation. (A) Sterility assay performed on cells maintained for 3 weeks in stationary phase before plating on YPD. The numbers above each bar represent the number of cells whose response to pheromone was scored at this point of their lifespan. (B) Multilabel immunohistochemical study of a typical cell from a population analyzed in A. Cells with an average generation of seven were obtained by sorting (average bud scar count = 7.2 ± 3.1). Sir3p colocalizes to nucleolar fragments. (C) ERC levels measured in nonstarved and starved cells. Starved cells are cells that have experienced 3 weeks in stationary phase before reexposure to fresh YPD. Nonstarved cells are cells obtained from logarithmic-phase cultures that have never been through stationary phase. Average bud scar count in the sorted starved populations labeled generations 1, 7, and 12 = 0.9 ± 1.1, 6.8 ± 2.6, and 12.4 ± 4.1, respectively; average bud scar count in the corresponding nonstarved populations = 0.9 ± 1.1, 7.4 ± 3.1, and 11.7 ± 3.8. The fractional representation of ERCs in each of the total cellular DNA preparations shown was defined by comparing signals from the ERC bands with signals from all bands by using a PhosphorImaging system. Fractional representation of ERCs for both nonstarved cells and starved cells are <1% at generation 1 and 23% at generation 7. At generation 12, the values are 32 and 33%, respectively. (D) Telomere length does not change appreciably as nonstarved and starved cells age. The same DNA preparations used in C were digested with _Xho_I. Southern blots were prepared and probed with a 600-bp fragment corresponding to the conserved Y′ region of yeast telomeres. The arrow points to a broad band, migrating at ≈1 kilobase, consisting of Y′ telomeres.
Figure 5
Model for diminished replicative lifespan of mother cells that have reentered the cell cycle after stationary phase. In control (nonstarved) cells, replicative aging of mother cells (solid time line) is caused by the sum of two processes, the accumulation of ERCs and the parallel accumulation of something else, termed X. These signals are summed and at some threshold elicit the aging phenotypes of sterility, nucleolar fragmentation, and growth arrest. Stationary-phase cells (starved) accumulate X while in stationary phase (dotted time line), so that their aging is advanced when they commence replicative growth (solid time line).
Similar articles
- Links between nucleolar activity, rDNA stability, aneuploidy and chronological aging in the yeast Saccharomyces cerevisiae.
Lewinska A, Miedziak B, Kulak K, Molon M, Wnuk M. Lewinska A, et al. Biogerontology. 2014 Jun;15(3):289-316. doi: 10.1007/s10522-014-9499-y. Epub 2014 Apr 8. Biogerontology. 2014. PMID: 24711086 Free PMC article. - Reproductive potential and instability of the rDNA region of the Saccharomyces cerevisiae yeast: Common or separate mechanisms of regulation?
Zadrag-Tecza R, Skoneczna A. Zadrag-Tecza R, et al. Exp Gerontol. 2016 Nov;84:29-39. doi: 10.1016/j.exger.2016.08.009. Epub 2016 Aug 18. Exp Gerontol. 2016. PMID: 27546186 - Telomere length constancy during aging of Saccharomyces cerevisiae.
D'Mello NP, Jazwinski SM. D'Mello NP, et al. J Bacteriol. 1991 Nov;173(21):6709-13. doi: 10.1128/jb.173.21.6709-6713.1991. J Bacteriol. 1991. PMID: 1938877 Free PMC article. - Telomeres, the nucleolus and aging.
Johnson FB, Marciniak RA, Guarente L. Johnson FB, et al. Curr Opin Cell Biol. 1998 Jun;10(3):332-8. doi: 10.1016/s0955-0674(98)80008-2. Curr Opin Cell Biol. 1998. PMID: 9640533 Review. - Aging in Saccharomyces cerevisiae.
Sinclair D, Mills K, Guarente L. Sinclair D, et al. Annu Rev Microbiol. 1998;52:533-60. doi: 10.1146/annurev.micro.52.1.533. Annu Rev Microbiol. 1998. PMID: 9891807 Review.
Cited by
- SOD2 functions downstream of Sch9 to extend longevity in yeast.
Fabrizio P, Liou LL, Moy VN, Diaspro A, Valentine JS, Gralla EB, Longo VD. Fabrizio P, et al. Genetics. 2003 Jan;163(1):35-46. doi: 10.1093/genetics/163.1.35. Genetics. 2003. PMID: 12586694 Free PMC article. - Chronological aging is associated with biophysical and chemical changes in the capsule of Cryptococcus neoformans.
Cordero RJ, Pontes B, Guimarães AJ, Martinez LR, Rivera J, Fries BC, Nimrichter L, Rodrigues ML, Viana NB, Casadevall A. Cordero RJ, et al. Infect Immun. 2011 Dec;79(12):4990-5000. doi: 10.1128/IAI.05789-11. Epub 2011 Oct 3. Infect Immun. 2011. PMID: 21968999 Free PMC article. - Chronological aging in Saccharomyces cerevisiae.
Longo VD, Fabrizio P. Longo VD, et al. Subcell Biochem. 2012;57:101-21. doi: 10.1007/978-94-007-2561-4_5. Subcell Biochem. 2012. PMID: 22094419 Free PMC article. Review. - Pathways change in expression during replicative aging in Saccharomyces cerevisiae.
Yiu G, McCord A, Wise A, Jindal R, Hardee J, Kuo A, Shimogawa MY, Cahoon L, Wu M, Kloke J, Hardin J, Mays Hoopes LL. Yiu G, et al. J Gerontol A Biol Sci Med Sci. 2008 Jan;63(1):21-34. doi: 10.1093/gerona/63.1.21. J Gerontol A Biol Sci Med Sci. 2008. PMID: 18245757 Free PMC article. - Replicative aging in yeast: the means to the end.
Steinkraus KA, Kaeberlein M, Kennedy BK. Steinkraus KA, et al. Annu Rev Cell Dev Biol. 2008;24:29-54. doi: 10.1146/annurev.cellbio.23.090506.123509. Annu Rev Cell Dev Biol. 2008. PMID: 18616424 Free PMC article. Review.
References
- Sinclair D A, Mills K D, Guarente L. Science. 1997;277:1313–1316. - PubMed
- Smeal T, Claus J, Kennedy B, Cole F, Guarente L. Cell. 1996;84:633–642. - PubMed
- D’mello N P, Childress A M, Franklin D S, Kale S P, Pinswasdi C, Jazwinski S M. J Biol Chem. 1994;269:15451–15459. - PubMed
- Sinclair D A, Mills K D, Guarente L. Annu Rev Microbiol. 1998;52:533–560. - PubMed
- Sun J, Kale S P, Childress A M, Pinswasdi C, Jazwinski S M. J Biol Chem. 1994;269:18638–18645. - PubMed
Publication types
MeSH terms
Substances
Grants and funding
- R01 AI038200/AI/NIAID NIH HHS/United States
- AI38200/AI/NIAID NIH HHS/United States
- R37 AG011119/AG/NIA NIH HHS/United States
- R01 AG011119/AG/NIA NIH HHS/United States
- AG11119/AG/NIA NIH HHS/United States
LinkOut - more resources
Full Text Sources
Other Literature Sources
Molecular Biology Databases


