Molecular characterization of a slowly gating human hyperpolarization-activated channel predominantly expressed in thalamus, heart, and testis - PubMed (original) (raw)
Molecular characterization of a slowly gating human hyperpolarization-activated channel predominantly expressed in thalamus, heart, and testis
R Seifert et al. Proc Natl Acad Sci U S A. 1999.
Abstract
Rhythmic activity of neurons and heart cells is endowed by pacemaker channels that are activated by hyperpolarization and directly regulated by cyclic nucleotides (termed HCN channels). These channels constitute a multigene family, and it is assumed that the properties of each member are adjusted to fit its particular function in the cell in which it resides. Here we report the molecular and functional characterization of a human subtype hHCN4. hHCN4 transcripts are expressed in heart, brain, and testis. Within the brain, the thalamus is the predominant area of hHCN4 expression. Heterologous expression of hHCN4 produces channels of unusually slow kinetics of activation and inactivation. The mean potential of half-maximal activation (V(1/2)) was -75.2 mV. cAMP shifted V(1/2) by 11 mV to more positive values. The hHCN4 gene was mapped to chromosome band 15q24-q25. The characteristic expression pattern and the sluggish gating suggest that hHCN4 controls the rhythmic activity in both thalamocortical neurons and pacemaker cells of the heart.
Figures
Figure 1
Primary structure of the human HCN4 channel and sequence comparison with mouse subtypes mHCN1–mHCN3. Identical residues with respect to hHCN4 sequence are represented by empty spaces and gaps by dashes. The six predicted transmembrane segments (S1–S6), the pore region, and the cyclic nucleotide-binding domain are indicated by bars above the sequence. Sequences of mHCN1–mHCN3 are from ref. .
Figure 2
Northern blot analysis of hHCN4 gene expression. Each lane contains 2 μg of poly(A)+ RNA from each of the following human tissues: He, heart; Br, total brain; Pl, placenta; Lu, lung; Li, liver; Mu, skeletal muscle; Ki, kidney; Pa, pancreas (A); Sp, spleen; Thy, thymus; Pr, prostata; Te, testis; Ov, ovary; In, small intestine; Co, colon; Leu, peripheral blood leukocytes (B); Am, amygdala; CN, caudate nucleus; CC, corpus callosum; Hi, hippocampus; Br, total brain; SN, substantia nigra; Th, thalamus (C); and Ce, cerebellum; CeC, cerebral cortex; Me, medulla; SC, spinal cord; OP, occipital pole; FL, frontal lobe; TL, temporal lobe; Pu, putamen (D). Blots were hybridized with a 32P-labeled 267-bp cDNA fragment.
Figure 3
Sections of human metaphase spreads after in situ hybridization with a biotinylated probe of hHCN4, detected with FITC conjugated to avidin. Arrows indicate the fluorescent signal on chromosome region 15q24–q25. Chromosomes were counterstained with DAPI.
Figure 4
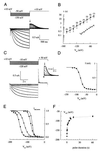
Functional characterization of hHCN4. (A) Whole-cell current responses to hyperpolarizing voltage steps from a holding potential of +10 mV to test values between −50 and −150 mV in increments of 10 mV. Tail currents were recorded by stepping the voltage back to +10 mV. The arrow indicates the instantaneous tail current. (B) Voltage dependence of the activation rates. Time constants τ (±SD, ●) of current activation were determined by fitting single exponentials to the current traces of recordings as in A (−130 to −150 mV) and in C (all other voltages). The number of experiments is given in parentheses. Time constants of activation of native _I_h currents (▴) recorded from thalamocortical neurons were taken from ref. ; ○ represent time constants for hHCN4 at 36°C, calculated from the data at 21°C, assuming a Q10 = 6. (C) Whole-cell current responses to hyperpolarizing voltage steps (see protocol above the current traces) of 7,500 ms duration (gray traces) and superimposed fit with a single exponential function (solid lines). The Inset shows tail currents recorded at +50 mV on an expanded time scale. (D) Voltage dependence of instantaneous tail currents (●), taken from C (Inset , arrow), representing the relative _P_o. Solid line is a fit of the Boltzmann function (I − _I_min)/(_I_max − _I_min) = [1 − exp([V − V1/2]/s)]−1 with V1/2 = −79.6 mV and s = 7.9 to the data. (E) Normalized tail currents (symbols) and fits (solid lines) of experiments with varying duration _t_p of the hyperpolarizing pulse: ■, _t_p = 300 ms, V1/2 = −151.4 mV; ○, _t_p = 1 s, V1/2 = −119.0 mV; ●, _t_p = 7.5 s, V1/2 = −85.2 mV; ▴, _t_p = 60 s, V1/2 = −75.2 mV. (F) Mean values ± SD for V1/2 (determined as in D and E) plotted against duration of the hyperpolarizing pulse. V1/2 saturates for long pulse durations (>60 s) at −75.2 (±3.4) mV.
Figure 5
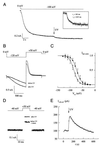
(A) Current responses to hyperpolarizing voltage steps to −120 mV for 1 s and tail currents recorded by stepping the voltage to the indicated value (see voltage protocol above the current traces). The arrow indicates the instantaneous tail-current amplitudes used for the I/Vm relation shown in B. (B) Instantaneous I/Vm relation derived from tail currents in A. The reversal potential was −22 mV.
Figure 6
Modulation of hHCN4-mediated currents by cAMP. (A) Incremental increase of steady-state current at −100 mV after photorelease of cAMP from caged cAMP. (Inset) Time course of flash-induced current increase displayed on a larger time scale. (B) Comparison of time courses of hHCN4 currents activated by steps to −120 mV before and after release of cAMP by the UV flash. (C) Voltage dependence of relative _P_o derived from tail current analysis similar to that shown in Fig. 4 C and D in the absence (○) and presence (●) of cAMP. Midpoint potentials (V1/2) and slope factors (s) were determined from a fit of the Boltzmann equation to the data. Mean V1/2 (control) = −85.2 ± 5.6 mV; s = 9.2 ± 1.9 mV (13 experiments); mean V1/2 (cAMP) = −74.1 ± 5.3 mV; s = 9.7 ± 2.1 mV (10 experiments). (D) Demonstration of open hHCN4 channels at a depolarized potential (−40 mV). From a holding voltage of −40 mV, short voltage pulses of 10-ms duration to +50 mV were repetetively applied every 10 s. After 100 s, a flash of UV light (500 ms) was applied, releasing cAMP from the caged compound. Three example traces are shown at t = 100 s, t = 140 s, and t = 550 s. Capacitive current transients have been removed for clarity. (E) Rise and decay of flash-induced changes in current amplitude measured at +50 mV in D.
Similar articles
- Two pacemaker channels from human heart with profoundly different activation kinetics.
Ludwig A, Zong X, Stieber J, Hullin R, Hofmann F, Biel M. Ludwig A, et al. EMBO J. 1999 May 4;18(9):2323-9. doi: 10.1093/emboj/18.9.2323. EMBO J. 1999. PMID: 10228147 Free PMC article. - Cloning and localization of the hyperpolarization-activated cyclic nucleotide-gated channel family in rat brain.
Monteggia LM, Eisch AJ, Tang MD, Kaczmarek LK, Nestler EJ. Monteggia LM, et al. Brain Res Mol Brain Res. 2000 Sep 30;81(1-2):129-39. doi: 10.1016/s0169-328x(00)00155-8. Brain Res Mol Brain Res. 2000. PMID: 11000485 - Structural basis for the cAMP-dependent gating in the human HCN4 channel.
Xu X, Vysotskaya ZV, Liu Q, Zhou L. Xu X, et al. J Biol Chem. 2010 Nov 19;285(47):37082-91. doi: 10.1074/jbc.M110.152033. Epub 2010 Sep 9. J Biol Chem. 2010. PMID: 20829353 Free PMC article. - The HCN gene family: molecular basis of the hyperpolarization-activated pacemaker channels.
Santoro B, Tibbs GR. Santoro B, et al. Ann N Y Acad Sci. 1999 Apr 30;868:741-64. doi: 10.1111/j.1749-6632.1999.tb11353.x. Ann N Y Acad Sci. 1999. PMID: 10414361 Review. - Cardiac HCN channels: structure, function, and modulation.
Biel M, Schneider A, Wahl C. Biel M, et al. Trends Cardiovasc Med. 2002 Jul;12(5):206-12. doi: 10.1016/s1050-1738(02)00162-7. Trends Cardiovasc Med. 2002. PMID: 12161074 Review.
Cited by
- Exploring characteristic features for effective HCN1 channel inhibition using integrated analytical approaches: 3D QSAR, molecular docking, homology modelling, ADME and molecular dynamics.
Sharma S, Rana P, Chadha VD, Dhingra N, Kaur T. Sharma S, et al. Eur Biophys J. 2024 Nov;53(7-8):447-464. doi: 10.1007/s00249-024-01726-8. Epub 2024 Nov 3. Eur Biophys J. 2024. PMID: 39488633 - Thalamic feedback shapes brain responses evoked by cortical stimulation in mice and humans.
Russo S, Claar L, Marks L, Krishnan G, Furregoni G, Zauli FM, Hassan G, Solbiati M, d'Orio P, Mikulan E, Sarasso S, Rosanova M, Sartori I, Bazhenov M, Pigorini A, Massimini M, Koch C, Rembado I. Russo S, et al. bioRxiv [Preprint]. 2024 Apr 12:2024.01.31.578243. doi: 10.1101/2024.01.31.578243. bioRxiv. 2024. PMID: 38352535 Free PMC article. Preprint. - Coexistence within one cell of microvillous and ciliary phototransductions across M1- through M6-IpRGCs.
Li G, Chen L, Jiang Z, Yau KW. Li G, et al. Proc Natl Acad Sci U S A. 2023 Dec 26;120(52):e2315282120. doi: 10.1073/pnas.2315282120. Epub 2023 Dec 18. Proc Natl Acad Sci U S A. 2023. PMID: 38109525 Free PMC article. - The enigmatic HCN channels: A cellular neurophysiology perspective.
Mishra P, Narayanan R. Mishra P, et al. Proteins. 2023 Nov 19:prot.26643. doi: 10.1002/prot.26643. Online ahead of print. Proteins. 2023. PMID: 37982354 Free PMC article. Review. - The impact of HCN4 channels on CNS brain networks as a new target in pain development.
Häfele M, Kreitz S, Ludwig A, Hess A, Wank I. Häfele M, et al. Front Netw Physiol. 2023 Jul 10;3:1090502. doi: 10.3389/fnetp.2023.1090502. eCollection 2023. Front Netw Physiol. 2023. PMID: 37496803 Free PMC article.
References
- Clapham D E. Neuron. 1998;21:5–7. - PubMed
- Pape H-C. Annu Rev Physiol. 1996;58:299–327. - PubMed
- Lüthi A, McCormick D A. Neuron. 1998;21:9–12. - PubMed
- DiFrancesco D. Annu Rev Physiol. 1993;55:455–472. - PubMed
- Bal T, McCormick D A. Neuron. 1996;17:297–308. - PubMed
Publication types
MeSH terms
Substances
LinkOut - more resources
Full Text Sources
Other Literature Sources
Molecular Biology Databases


