Subtype-dependence of NMDA receptor channel open probability - PubMed (original) (raw)
Subtype-dependence of NMDA receptor channel open probability
N Chen et al. J Neurosci. 1999.
Abstract
NMDA receptor-mediated calcium transients play a critical role in synaptogenesis, synaptic plasticity, and excitotoxicity. NMDA receptors are heteromeric complexes of NR1A combined with NR2A, NR2B, NR2C, and/or NR2D subunits. The NR2 subunits determine a variety of electrophysiological and pharmacological properties of the NMDA receptor complex. In this report, we provide evidence for the first time that there is also a significant difference in peak channel open probability (P(o)) between NMDA receptors composed of NR1A/NR2A and those of NR1A/NR2B subunits. First, whole-cell patch-clamp recordings from human embryonic kidney (HEK) 293 cells expressing NMDA receptors revealed that NR1A/NR2A-mediated peak current densities are approximately four times larger than those of NR1A/NR2B. We show that this fourfold difference is unlikely caused by differences in receptor surface expression, since these levels were similar for the two subtypes by Western blot analysis. To determine whether P(o) contributed to the difference in peak current densities, we used two different open channel antagonists, MK-801 and 9-aminoacridine, in a variety of experimental paradigms. Our results indicate that peak P(o) is significantly higher (twofold to fivefold) for NR1A/NR2A than NR1A/NR2B, with estimated values of approximately 0.35 and 0.07, respectively. These results suggest that a change in the relative expression levels of NR2A and NR2B can regulate peak amplitude of NMDA receptor-mediated excitatory postsynaptic potentials and therefore may play a role in mechanisms underlying synaptic plasticity.
Figures
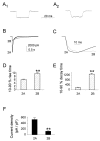
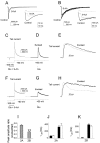
Fig. 1.
Peak current density of agonist-evoked responses is larger for recordings from cells transfected with NR1A/NR2A than NR1A/NR2B. _A_1,_A_2, Representative traces of open tip recording (_A_1) or whole-cell current (_A_2) made by switching between NMG-containing and NaCl-containing extracellular solutions.B, Representative current traces in response to 20 msec application of 1 m
m
glutamate (in continuous presence of 50 μ
m
glycine) recorded from a cell transfected with either NR1A/NR2A (thick line) or NR1A/NR2B (thin line). C, NR1A/NR2B current trace (thin line) normalized to the peak of an NR1A/NR2A current trace (thick line) to illustrate difference in activation time courses. D, Bars show mean ± SEM for 10–90% rise-time (n = 10 for both subtypes; **p < 0.01 by unpaired t test).E, Mean ± SEM for 10–90% decay time (n = 10 for both subtypes; **p< 0.01 by unpaired t test). F, Bars indicate mean ± SEM for current responses to 100 μ
m
glutamate (in the continuous presence of 50 μ
m
glycine) recorded from n = 60 (NR1A/NR2A) or_n_ = 106 (NR1A/NR2B) different cells. **p < 0.001 by unpaired _t_test.
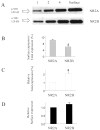
Fig. 2.
Cells transfected with NR1A/NR2A or NR1A/NR2B show similar levels of NR1A surface expression. A,Representative Western blot of membrane fraction of lysates from NR1A/NR2A- and NR1A/NR2B-transfected cells probed with anti-NR1A antibody. 1, 2, and 4_represent micrograms of protein loaded in each lane;Surface represents neutravidin bead-precipitated receptors. B–D, Band intensities from Western blots were analyzed by densitometry, and bars represent mean ± SEM from n = 4 experiments. In B,the fraction of total NR1A protein expressed at the cell surface in each experiment was calculated by comparing “surface” band intensity to band intensities in lanes loaded with total membrane protein (1, 2, and_4). *p < 0.05 by unpaired_t test. In C, band intensities measured for lanes 1, 2, and 4 of NR1A/NR2B cell lysates in each experiment were normalized to the values measured for lanes loaded with equal amounts of membrane protein from NR1A/NR2A-transfected cells. *p < 0.05 by paired_t test. In D, the fraction of total NR1A/NR2B expressed at the cell surface in each experiment (see_B) was normalized for the difference in relative total receptor expression of NR1A/NR2A and NR1A/NR2B (see_C).
Fig. 3.
Peak current and decay phase attenuated in continuous presence of MK-801. _A_1,_B_1, Agonist-evoked current before (Control) and after (Wash) the application of 20 μ
m
MK-801 in both agonist and control solutions, recorded from an NR1A/NR2A (_A_1)- or an NR1A/NR2B (_B_1)-transfected cell under voltage-clamp configuration (−60 mV). _A_2,_B_2, Agonist-evoked current in the absence (trace a) or in the presence (trace b) of MK-801 in both solutions was recorded from an NR1A/NR2A (_A_2)- or an NR1A/NR2B (B_2)-transfected cell. Peak current in the presence of MK-801 (b) was normalized to that in the absence of antagonist (a). Cumulative charge transfer time course curves (trace Sa and_trace Sb) were obtained by integrating corresponding traces (a and b, respectively) over time. Fifty micromolar glycine was included in all solutions.C, Bars show mean ± SEM for fraction of total charge transfer remaining after wash-out of 20 μ
m
MK801 (n = 5 for NR1A/NR2A and n = 6 for NR1A/NR2B; p = 0.23, unpaired t test).D, Mean ± SEM for peak current measured in the presence of MK-801 normalized to that measured under control conditions (n = 4 for both subtypes; p = 0.15 by unpaired t test). The circles at the top of the figure illustrate the tip of the piezo-driven θ tube (see Materials and Methods) and the solutions used for recording:C, Control; G, 1 m
m
glutamate; M, MK-801. Extracellular solution contained 0.2 m
m
calcium.
Fig. 4.
Brief pulse of 200 μ
m
MK-801, applied together with glutamate, attenuates only the peak NMDA receptor-mediated current response. Recordings made from representative cells expressing NR1A/NR2A (A) or NR1A/NR2B_(B)._ After establishing a stable current response to 20 msec application of 1 m
m
glutamate alone (A 1 , B1,Control), 200 μ
m
MK-801 was added to agonist solution, and a single response was recorded (A2, B2,MK-801). The glutamate-evoked current response recorded after extensive wash-out of MK-801 is shown in_A3_ and B_3(Wash). Normalized current traces shown on expanded time scale in A 4 and_B 4 illustrate that the decay phases of the control (thick line), MK-801, and wash (both shown as thin lines) traces all follow the same time course; open tip recordings for these experiments are shown above traces. Extracellular solution contained 0.2 m
m
calcium.
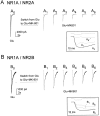
Fig. 5.
Representative current traces showing progressive attenuation of peak glutamate-evoked currents by 20 μ
m
MK-801 present only in agonist solution. Recordings were made in the continuous presence of 50 μ
m
glycine from a cell transfected with NR1A/NR2A (A) or NR1A/NR2B (B). A0,B0, Representative control responses to 20 msec application of 1 m
m
glutamate alone.A1–6,B1–6, Successive current responses to simultaneous application of 1 m
m
glutamate and 20 μ
m
MK-801 for 20 msec at 20 sec intervals.Insets show selected traces on an expanded time scale, along with the open tip recording to indicate speed of solution exchange in these experiments. Extracellular solution contained 0.2 m
m
calcium.
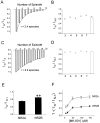
Fig. 6.
Progressive block by MK-801 of peak glutamate-evoked current is more rapid for NR1A/NR2A than NR1A/NR2B.A–D, Graphic representation of progressive MK-801 block in recordings from cell transfected with NR1A/NR2A (A, B) or NR1A/NR2B (C, D).A, C, Peak current amplitude measured with each successive pulse of glutamate plus MK-801 was normalized to the peak current response to the second application of 1 m
m
glutamate plus MK-801. Decay of peak current was fit by a single exponential function. B, D, Peak current amplitude recorded in response to each successive pulse of glutamate plus MK-801 (_I_N) was normalized to peak current amplitude recorded in response to the previous glutamate plus MK-801 pulse (_I_N−1). The mean ratio (± SEM) for five pulses (the third through seventh pulse in MK-801) is shown at the far right of each plot. E, Bars indicate mean ± SEM for pooled data from n = 8 (NR1A/NR2A) or n = 11 (NR1A/NR2B) different cells. Significant difference by unpaired t test, **p< 0.01. F, The fraction of peak current blocked with each successive pulse of MK-801 plus glutamate (1 − [_I_N/_I_N−1]) was calculated from recordings made from n = 5–11 cells, for each of five different MK-801 concentrations.
Fig. 7.
9-aminoacridine block reveals larger fraction of channels open after the peak response for NR1A/NR2B than NR1A/NR2A.A, B, Representative traces showing NR1A/NR2A (A) or NR1A/NR2B (B) mediated current evoked by 20 msec application of 1 m
m
glutamate (Control, thick line) or 1 m
m
glutamate plus 100 μ
m
9-AA (9-AA, thin line). Holding potential was −60 mV. The top trace in the inset is the open tip recording at the end of the experiment. C–H, Representative traces recorded from cell expressing NR1A/NR2A (C–E) or NR1A/NR2B (F–H). Current elicited by voltage switch from −100 to +60 mV 20 msec after a 500 msec application of 1 m
m
glutamate plus 100 μ
m
9-AA (C, F, Tail current, thin lines). Current evoked by 20 msec application of 1 m
m
glutamate at a holding potential of +60 mV (D, G, Evoked, thick lines). E and H show same currents on expanded time scale and evoked current peaks are normalized to those of tail currents. I–K, Bars represent mean ± SEM from n = 6 different cells for each subtype.J (for NR1A/NR2A) and K (for NR1A/NR2B) compare the time constant or constants of current decay for voltage-activated currents immediately after 9-AA application (filled bars) with those for glutamate-evoked currents (open bars), both obtained at holding potentials of +60 mV. **p < 0.01 by unpaired_t_ test. Extracellular solution contained 0.2 m
m
calcium.
Similar articles
- Effects of memantine on recombinant rat NMDA receptors expressed in HEK 293 cells.
Bresink I, Benke TA, Collett VJ, Seal AJ, Parsons CG, Henley JM, Collingridge GL. Bresink I, et al. Br J Pharmacol. 1996 Sep;119(2):195-204. doi: 10.1111/j.1476-5381.1996.tb15971.x. Br J Pharmacol. 1996. PMID: 8886398 Free PMC article. - Antagonist properties of eliprodil and other NMDA receptor antagonists at rat NR1A/NR2A and NR1A/NR2B receptors expressed in Xenopus oocytes.
Avenet P, Léonardon J, Besnard F, Graham D, Depoortere H, Scatton B. Avenet P, et al. Neurosci Lett. 1997 Feb 21;223(2):133-6. doi: 10.1016/s0304-3940(97)13422-x. Neurosci Lett. 1997. PMID: 9089691 - Pharmacological heterogeneity of NMDA receptors: characterization of NR1a/NR2D heteromers expressed in Xenopus oocytes.
Buller AL, Monaghan DT. Buller AL, et al. Eur J Pharmacol. 1997 Feb 5;320(1):87-94. doi: 10.1016/s0014-2999(96)00880-1. Eur J Pharmacol. 1997. PMID: 9049607 - Subunit-specific effects of poricoic acid A on NMDA receptors.
Lee J, Kim C, Yeom HD, Nguyen KVA, Eom S, Lee S, Jung JH, Lee JH, Kim SH, Kim IK, Lee JH. Lee J, et al. Pharmacol Rep. 2020 Apr;72(2):472-480. doi: 10.1007/s43440-019-00036-7. Epub 2020 Feb 11. Pharmacol Rep. 2020. PMID: 32048268
Cited by
- Activation of metabotropic glutamate receptor 1 accelerates NMDA receptor trafficking.
Lan JY, Skeberdis VA, Jover T, Zheng X, Bennett MV, Zukin RS. Lan JY, et al. J Neurosci. 2001 Aug 15;21(16):6058-68. doi: 10.1523/JNEUROSCI.21-16-06058.2001. J Neurosci. 2001. PMID: 11487629 Free PMC article. - Schaffer collateral and perforant path inputs activate different subtypes of NMDA receptors on the same CA1 pyramidal cell.
Arrigoni E, Greene RW. Arrigoni E, et al. Br J Pharmacol. 2004 May;142(2):317-22. doi: 10.1038/sj.bjp.0705744. Br J Pharmacol. 2004. PMID: 15155538 Free PMC article. - Distribution of NMDA and AMPA receptor subunits at thalamo-amygdaloid dendritic spines.
Radley JJ, Farb CR, He Y, Janssen WG, Rodrigues SM, Johnson LR, Hof PR, LeDoux JE, Morrison JH. Radley JJ, et al. Brain Res. 2007 Feb 23;1134(1):87-94. doi: 10.1016/j.brainres.2006.11.045. Epub 2007 Jan 17. Brain Res. 2007. PMID: 17207780 Free PMC article. - Voltage opens unopposed gap junction hemichannels formed by a connexin 32 mutant associated with X-linked Charcot-Marie-Tooth disease.
Abrams CK, Bennett MV, Verselis VK, Bargiello TA. Abrams CK, et al. Proc Natl Acad Sci U S A. 2002 Mar 19;99(6):3980-4. doi: 10.1073/pnas.261713499. Epub 2002 Mar 12. Proc Natl Acad Sci U S A. 2002. PMID: 11891346 Free PMC article. - Structure, Function, and Pharmacology of Glutamate Receptor Ion Channels.
Hansen KB, Wollmuth LP, Bowie D, Furukawa H, Menniti FS, Sobolevsky AI, Swanson GT, Swanger SA, Greger IH, Nakagawa T, McBain CJ, Jayaraman V, Low CM, Dell'Acqua ML, Diamond JS, Camp CR, Perszyk RE, Yuan H, Traynelis SF. Hansen KB, et al. Pharmacol Rev. 2021 Oct;73(4):298-487. doi: 10.1124/pharmrev.120.000131. Pharmacol Rev. 2021. PMID: 34753794 Free PMC article. Review.
References
- Carmignoto G, Vicini S. Activity-dependent decrease in NMDA receptor responses during development of the visual cortex. Science. 1992;258:1007–1011. - PubMed
Publication types
MeSH terms
Substances
LinkOut - more resources
Full Text Sources
Miscellaneous
