Systematic changes in gene expression patterns following adaptive evolution in yeast - PubMed (original) (raw)
Systematic changes in gene expression patterns following adaptive evolution in yeast
T L Ferea et al. Proc Natl Acad Sci U S A. 1999.
Abstract
Culturing a population of Saccharomyces cerevisiae for many generations under conditions to which it is not optimally adapted selects for fitter genetic variants. This simple experimental design provides a tractable model of adaptive evolution under natural selection. Beginning with a clonal, founding population, independently evolved strains were obtained from three independent cultures after continuous aerobic growth in glucose-limited chemostats for more than 250 generations. DNA microarrays were used to compare genome-wide patterns of gene expression in the evolved strains and the parental strain. Several hundred genes were found to have significantly altered expression in the evolved strains. Many of these genes showed similar alterations in their expression in all three evolved strains. Genes with altered expression in the three evolved strains included genes involved in glycolysis, the tricarboxylic acid cycle, oxidative phosphorylation, and metabolite transport. These results are consistent with physiological observations and indicate that increased fitness is acquired by altering regulation of central metabolism such that less glucose is fermented and more glucose is completely oxidized.
Figures
Figure 1
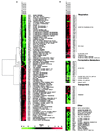
Graphical representations of the differences in transcript abundance between the evolved strains and the parental strain for the 88 functionally characterized genes whose transcripts differed by at least 2-fold on two or more microarrays. The ratio of transcript levels in the evolved strain compared with the parental strain, measured for each gene, is represented by the color of the corresponding box in this graphical display (see scale). Red represents a higher level of expression in the evolved strain, and green represents a higher level of expression in the parental strain. The color saturation represents the magnitude of the expression ratio, as indicated by the scale at the bottom of the figure. Black indicates no detectable difference in expression levels; gray denotes a missing observation. (a) Hierarchical clustering of gene expression. Relationships in expression patterns among the genes are represented by the tree at the left of the display, with branch lengths indicative of the magnitude of the differences between gene expression patterns (16). (b) Expression patterns organized according to functionally defined categories.
Figure 2
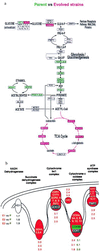
(a) Alterations in gene expression consistent in two or more experiments are projected onto metabolic maps of central carbon metabolism. Increases (red) and decreases (green) of 2-fold or greater in transcripts encoding the enzymes that mediate the steps in these pathways are represented by the color of the corresponding box. (b) Average expression ratios for sets of genes encoding the mitochondrial protein complexes involved in oxidative phosphorylation. The expression ratios for COX5B, the differentially expressed isozyme of COX5A, are indicated separately from the other components of cytochrome c oxidase complex.
Figure 3
Cells were cultured aerobically in the chemostat at 30°C with glucose limitation (0.08%), harvested, and fixed in formaldehyde. Cells were stained with DAPI and photographed with a Delta Vision microscope (Applied Imaging Systems) to compare the abundance of mitochondrial DNA in the parental and evolved strains. (A) Parental strain. (B, C, and D) Isolates from the three evolved populations E1, E2, and E3, respectively.
Similar articles
- Genomic analysis of Saccharomyces cerevisiae isolates that grow optimally with glucose as the sole carbon source.
Aragon AD, Torrez-Martinez N, Edwards JS. Aragon AD, et al. Electrophoresis. 2012 Dec;33(23):3514-20. doi: 10.1002/elps.201200172. Epub 2012 Nov 8. Electrophoresis. 2012. PMID: 23135695 Free PMC article. - Prolonged selection in aerobic, glucose-limited chemostat cultures of Saccharomyces cerevisiae causes a partial loss of glycolytic capacity.
Jansen MLA, Diderich JA, Mashego M, Hassane A, de Winde JH, Daran-Lapujade P, Pronk JT. Jansen MLA, et al. Microbiology (Reading). 2005 May;151(Pt 5):1657-1669. doi: 10.1099/mic.0.27577-0. Microbiology (Reading). 2005. PMID: 15870473 - Adaptation of Saccharomyces cerevisiae to saline stress through laboratory evolution.
Dhar R, Sägesser R, Weikert C, Yuan J, Wagner A. Dhar R, et al. J Evol Biol. 2011 May;24(5):1135-53. doi: 10.1111/j.1420-9101.2011.02249.x. Epub 2011 Mar 7. J Evol Biol. 2011. PMID: 21375649 - Changes in the metabolome of Saccharomyces cerevisiae associated with evolution in aerobic glucose-limited chemostats.
Mashego MR, Jansen ML, Vinke JL, van Gulik WM, Heijnen JJ. Mashego MR, et al. FEMS Yeast Res. 2005 Feb;5(4-5):419-30. doi: 10.1016/j.femsyr.2004.11.008. FEMS Yeast Res. 2005. PMID: 15691747 - The functional basis of adaptive evolution in chemostats.
Gresham D, Hong J. Gresham D, et al. FEMS Microbiol Rev. 2015 Jan;39(1):2-16. doi: 10.1111/1574-6976.12082. Epub 2014 Dec 4. FEMS Microbiol Rev. 2015. PMID: 25098268 Free PMC article. Review.
Cited by
- Laboratory evolution of Geobacter sulfurreducens for enhanced growth on lactate via a single-base-pair substitution in a transcriptional regulator.
Summers ZM, Ueki T, Ismail W, Haveman SA, Lovley DR. Summers ZM, et al. ISME J. 2012 May;6(5):975-83. doi: 10.1038/ismej.2011.166. Epub 2011 Nov 24. ISME J. 2012. PMID: 22113376 Free PMC article. - Evolutionary and Biochemical Aspects of Chemical Stress Resistance in Saccharomyces cerevisiae.
Venancio TM, Bellieny-Rabelo D, Aravind L. Venancio TM, et al. Front Genet. 2012 Mar 30;3:47. doi: 10.3389/fgene.2012.00047. eCollection 2012. Front Genet. 2012. PMID: 22479268 Free PMC article. - The emergence of adaptive laboratory evolution as an efficient tool for biological discovery and industrial biotechnology.
Sandberg TE, Salazar MJ, Weng LL, Palsson BO, Feist AM. Sandberg TE, et al. Metab Eng. 2019 Dec;56:1-16. doi: 10.1016/j.ymben.2019.08.004. Epub 2019 Aug 8. Metab Eng. 2019. PMID: 31401242 Free PMC article. Review. - Omic data from evolved E. coli are consistent with computed optimal growth from genome-scale models.
Lewis NE, Hixson KK, Conrad TM, Lerman JA, Charusanti P, Polpitiya AD, Adkins JN, Schramm G, Purvine SO, Lopez-Ferrer D, Weitz KK, Eils R, König R, Smith RD, Palsson BØ. Lewis NE, et al. Mol Syst Biol. 2010 Jul;6:390. doi: 10.1038/msb.2010.47. Mol Syst Biol. 2010. PMID: 20664636 Free PMC article. - Integrating functional genomic information into the Saccharomyces genome database.
Ball CA, Dolinski K, Dwight SS, Harris MA, Issel-Tarver L, Kasarskis A, Scafe CR, Sherlock G, Binkley G, Jin H, Kaloper M, Orr SD, Schroeder M, Weng S, Zhu Y, Botstein D, Cherry JM. Ball CA, et al. Nucleic Acids Res. 2000 Jan 1;28(1):77-80. doi: 10.1093/nar/28.1.77. Nucleic Acids Res. 2000. PMID: 10592186 Free PMC article.
References
- De Deken R H. J Gen Microbiol. 1966;44:149–156. - PubMed
- Lagunas R. Mol Cell Biochem. 1979;2:139–146S. - PubMed
- Lagunas R. Yeast. 1986;2:221–228. - PubMed
- DeRisi J L, Iyer V R, Brown P O. Science. 1997;278:680–686. - PubMed
- Ronne M. Trends Genet. 1995;11:12–17. - PubMed
Publication types
MeSH terms
Substances
Grants and funding
- R01 GM046406/GM/NIGMS NIH HHS/United States
- HG00450/HG/NHGRI NIH HHS/United States
- R01 CA077097/CA/NCI NIH HHS/United States
- HG 00983/HG/NHGRI NIH HHS/United States
- R37 GM046406/GM/NIGMS NIH HHS/United States
- T32 HG000044/HG/NHGRI NIH HHS/United States
- GM 46406/GM/NIGMS NIH HHS/United States
LinkOut - more resources
Full Text Sources
Other Literature Sources
Molecular Biology Databases


