Decoding photoperiodic time through Per1 and ICER gene amplitude - PubMed (original) (raw)
Decoding photoperiodic time through Per1 and ICER gene amplitude
S Messager et al. Proc Natl Acad Sci U S A. 1999.
Abstract
The mammalian Per1 gene is expressed in the suprachiasmatic nucleus of the hypothalamus, where it is thought to play a critical role in the generation of circadian rhythms. Per1 mRNA also is expressed in other tissues. Its expression in the pars tuberalis (PT) of the pituitary is noteworthy because, like the suprachiasmatic nucleus, it is a known site of action of melatonin. The duration of the nocturnal melatonin signal encodes photoperiodic time, and many species use this to coordinate physiological adaptations with the yearly climatic cycle. This study reveals how the duration of photoperiodic time, conveyed through melatonin, is decoded as amplitude of Per1 and ICER (inducible cAMP early repressor) gene expression in the PT. Syrian hamsters display a robust and transient peak of Per1 and ICER gene expression 3 h after lights-on (Zeitgeber time 3) in the PT, under both long (16 h light/8 h dark) and short (8 h light/16 h dark) photoperiods. However, the amplitude of these peaks is greatly attenuated under a short photoperiod. The data show how amplitude of these genes may be important to the long-term measurement of photoperiodic time intervals.
Figures
Figure 1
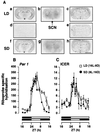
Effect of photoperiod on the temporal pattern of expression of Per1 and ICER mRNA in the PT of the Syrian hamster. (A) Autoradiographs showing the expression of Per1 and ICER mRNA and 2-[125I]iodomelatonin binding in the PT and adjacent brain areas. Coronal sections (20 μm) show gene expression or radioligand binding at ZT3 under LD and SD. Sections a–c are consecutive sections showing antisense labeling for Per1 (a) and ICER (c) and 2-[125I]iodomelatonin binding (b) under LD. Sections f_–_h are consecutive sections showing antisense labeling for Per1 (f) and ICER (h) and 2-[125I]iodomelatonin binding (g) under SD. Sections d and e show sense labeling for Per1 (d) and ICER (e) under LD. (Bar = 4 mm.) (B and C) Diurnal pattern of expression of Per1 (B) and ICER (C) riboprobe-specific hybridization in the pars tuberalis in LD (□) and SD (●). Each value is the mean ± SEM of two to six animals per time point. The horizontal solid bars represent the dark period for LD and SD. (D) A schematic showing the effect of changing from LD to SD on the endogenous melatonin rhythm when the time of lights-on is kept the same for both photoperiods, as used in this experiment. The melatonin rhythm decompresses slowly over several cycles toward lights-off (20).
Figure 2
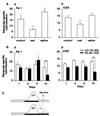
(A) Effect of exogenous melatonin on the expression of Per1 (a) and ICER (b) mRNA at ZT3 in the PT of Syrian hamsters held under LD. Animals received no treatment (control), were injected with 25 μg of melatonin 1 h before lights-on (mel), or were injected with vehicle (saline). Each value is the mean ± SEM from three animals (∗, P < 0.05). (B) Expression of Per1 (a) and ICER (b) mRNA in the PT 1, 2, 5, and 14 days after a switch from LD to SD. Each value is the mean ± SEM of three animals (∗∗, P < 0.001). (C) Schematic showing the effect of changing from LD to SD on the endogenous melatonin rhythm when the timing of lights-off is held constant as in this experiment. The melatonin rhythm decompresses slowly over many cycles toward lights-on (20).
Figure 3
Effect of photoperiod on the temporal pattern of expression of Per1 and ICER mRNA in the SCN of the Syrian hamster. (A) Autoradiographs showing the expression of Per1 and ICER mRNA and 2-[125I]iodomelatonin binding in the SCN and adjacent brain areas. Coronal sections (20 μm) show gene expression or radioligand binding at ZT3 under LD and SD. Sections a–c are consecutive sections showing antisense labeling for Per1 (a) and ICER (c) and 2-[125I]iodomelatonin binding (b) under LD. Sections f_–_h are consecutive sections showing antisense labeling of Per1 (f) and ICER (h) and 2-[125I]iodomelatonin binding (g) under SD. Sections d and e show sense labeling for Per1 (d) and ICER (e) under LD. (Bar = 4 mm.) (B and C) Diurnal pattern of expression of Per1 (B) and ICER (C) riboprobe-specific hybridization in the SCN in LD (□) and SD (●). Each value is the mean ± SEM of two to six animals per time point. The horizontal solid bars represent the dark period for LD and SD. The time of lights-on was held constant between LD and SD as described in Fig. 1.
Figure 4
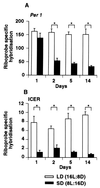
Expression of Per1 (A) and ICER (B) mRNA at ZT3 in the SCN 1, 2, 5, and 14 days after a switch from LD to SD. The time of lights-off was held constant between LD and SD (see Fig. 2_C_). Each value is the mean ± SEM of three animals. (∗, P < 0.01).
Similar articles
- Photoperiod differentially regulates the expression of Per1 and ICER in the pars tuberalis and the suprachiasmatic nucleus of the Siberian hamster.
Messager S, Hazlerigg DG, Mercer JG, Morgan PJ. Messager S, et al. Eur J Neurosci. 2000 Aug;12(8):2865-70. doi: 10.1046/j.1460-9568.2000.00174.x. Eur J Neurosci. 2000. PMID: 10971629 - Rhythmic melatonin secretion does not correlate with the expression of arylalkylamine N-acetyltransferase, inducible cyclic amp early repressor, period1 or cryptochrome1 mRNA in the sheep pineal.
Johnston JD, Bashforth R, Diack A, Andersson H, Lincoln GA, Hazlerigg DG. Johnston JD, et al. Neuroscience. 2004;124(4):789-95. doi: 10.1016/j.neuroscience.2004.01.011. Neuroscience. 2004. PMID: 15026119 - Evidence for an endogenous per1- and ICER-independent seasonal timer in the hamster pituitary gland.
Johnston JD, Cagampang FR, Stirland JA, Carr AJ, White MR, Davis JR, Loudon AS. Johnston JD, et al. FASEB J. 2003 May;17(8):810-5. doi: 10.1096/fj.02-0837com. FASEB J. 2003. PMID: 12724339 - Clock genes in calendar cells as the basis of annual timekeeping in mammals--a unifying hypothesis.
Lincoln GA, Andersson H, Loudon A. Lincoln GA, et al. J Endocrinol. 2003 Oct;179(1):1-13. doi: 10.1677/joe.0.1790001. J Endocrinol. 2003. PMID: 14529560 Review. - Signaling pathways to and from the hypophysial pars tuberalis, an important center for the control of seasonal rhythms.
Korf HW. Korf HW. Gen Comp Endocrinol. 2018 Mar 1;258:236-243. doi: 10.1016/j.ygcen.2017.05.011. Epub 2017 May 13. Gen Comp Endocrinol. 2018. PMID: 28511899 Review.
Cited by
- Daily variations in plasma melatonin and melatonin receptor (MT1), PER1 and CRY1 expression in suprachiasmatic nuclei of tropical squirrel, Funambulus pennanti.
Gupta S, Haldar C, Singh S. Gupta S, et al. J Comp Physiol A Neuroethol Sens Neural Behav Physiol. 2013 Sep;199(9):763-73. doi: 10.1007/s00359-013-0836-4. Epub 2013 Jul 13. J Comp Physiol A Neuroethol Sens Neural Behav Physiol. 2013. PMID: 23852344 - Seasonal aspects of sleep in the Djungarian hamster.
Palchykova S, Deboer T, Tobler I. Palchykova S, et al. BMC Neurosci. 2003 May 19;4:9. doi: 10.1186/1471-2202-4-9. BMC Neurosci. 2003. PMID: 12756056 Free PMC article. - Heterogeneity of rhythmic suprachiasmatic nucleus neurons: Implications for circadian waveform and photoperiodic encoding.
Schaap J, Albus H, VanderLeest HT, Eilers PH, Détári L, Meijer JH. Schaap J, et al. Proc Natl Acad Sci U S A. 2003 Dec 23;100(26):15994-9. doi: 10.1073/pnas.2436298100. Epub 2003 Dec 11. Proc Natl Acad Sci U S A. 2003. PMID: 14671328 Free PMC article. - Day-length encoding through tonic photic effects in the retinorecipient SCN region.
Yan L, Silver R. Yan L, et al. Eur J Neurosci. 2008 Nov;28(10):2108-15. doi: 10.1111/j.1460-9568.2008.06493.x. Eur J Neurosci. 2008. PMID: 19046391 Free PMC article. - Network-mediated encoding of circadian time: the suprachiasmatic nucleus (SCN) from genes to neurons to circuits, and back.
Brancaccio M, Enoki R, Mazuski CN, Jones J, Evans JA, Azzi A. Brancaccio M, et al. J Neurosci. 2014 Nov 12;34(46):15192-9. doi: 10.1523/JNEUROSCI.3233-14.2014. J Neurosci. 2014. PMID: 25392488 Free PMC article. Review.
References
- Klein D C, Moore R Y, Reppert S M. Suprachiasmatic Nucleus: The Mind’s Clock. Oxford: Oxford Univ. Press; 1991.
- Sun Z S, Albrecht U, Zhuchenko O, Bailey J, Eichele G, Lee C C. Cell. 1997;90:1003–1011. - PubMed
- Tei H, Okamura H, Shigeyoshi Y, Fukuhara C, Ozawa R, Hirose M, Sakaki Y. Nature (London) 1997;389:512–516. - PubMed
- Balsalobre A, Damiola F, Schibler U. Cell. 1998;93:929–937. - PubMed
- Morgan P J, Williams L M. Rev Reprod. 1996;1:153–161. - PubMed
Publication types
MeSH terms
Substances
LinkOut - more resources
Full Text Sources
Miscellaneous


