Biophysical properties of mouse connexin30 gap junction channels studied in transfected human HeLa cells - PubMed (original) (raw)
Biophysical properties of mouse connexin30 gap junction channels studied in transfected human HeLa cells
V Valiunas et al. J Physiol. 1999.
Abstract
1. Human HeLa cells expressing mouse connexin30 (Cx30) were used to study the electrical properties of Cx30 gap junction channels. Experiments were performed on cell pairs with the dual voltage-clamp method. 2. The gap junction conductance (gj) at steady state showed a bell-shaped dependence on junctional voltage (Vj; Boltzmann fit: Vj,0 = 27 mV, gj,min = 0.15, z = 4). The instantaneous gj decreased slightly with increasing Vj. 3. The gap junction currents (Ij) declined with time following a single exponential. The time constants of Ij inactivation (taui) decreased with increasing Vj. 4. Single channels exhibited a main state, a residual state and a closed state. The conductances gammaj,main and gammaj,residual were 179 and 48 pS, respectively (pipette solution, potassium aspartate; temperature, 36-37 degrees C; extrapolated to Vj = 0 mV). 5. The conductances gammaj,residual and gammaj,main showed a slight Vj dependence and were sensitive to temperature (Q10 values of 1.28 and 1.16, respectively). 6. Current transitions between open states (i.e. main state, substates, residual state) were fast (< 2 ms), while those between an open state and the closed state were slow (12 ms). 7. The open channel probability (Po) at steady state decreased from 1 to 0 with increasing Vj (Boltzmann fit: Vj,0 = 37 mV; z = 3). 8. Histograms of channel open times implied the presence of a single main state; histograms of channel closed times suggested the existence of two closed states (i.e. residual states). 9. We conclude that Cx30 channels are controlled by two types of gates, a fast one responsible for Vj gating involving transitions between open states (i.e. residual state, main state), and a slow one correlated with chemical gating involving transitions between the closed state and an open state.
Figures
Figure 1. Northern blot analysis of total RNA from HeLa cells
Total RNA was extracted from Cx30-transfected human HeLa cells and wild-type cells, electrophoresed, blotted onto nylon membrane, hybridised to a 32P-labelled Cx30 probe (PCR fragment, nucleotide position 25-616) under high stringency conditions and autoradiographed. Lines 1-5 correspond to different clones of Cx30-transfected HeLa cells and wild-type HeLa cells (wt). The different transcripts in lane 3 may have resulted from different transcriptional termination sites of several copies of the inserted plasmid DNA. The bar marks the location of the 1.1 kb band of Cx30 mRNA.
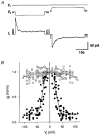
Figure 2. Dependence of intercellular coupling on transjunctional voltage (_V_j)
A, responses of gap junction currents (_I_j) to _V_j. Records illustrate the membrane potential of cell 1 (_V_1) and cell 2 (_V_2) and the current measured from cell 1 (_I_1). Deflections in _V_2 and _I_1 correspond to _V_j and _I_j, respectively. Long _V_j pulses of ±40 mV gave rise to a time-dependent _I_j. Short _V_j pulses (downward deflections in _V_2) served to monitor the stability of _I_j (upward deflections in _I_1). Holding potential, _V_h= -20 mV. B, plot of normalised _g_j determined at the make (_g_j,inst; ○) and break (_g_j,ss; •) of _V_j pulses _versus V_j. Each symbol corresponds to a single determination. Data from 8 cell pairs. ○, instantaneous data; for curve fitting procedure, see text. •, steady-state data; continuous curve represents the best fit of data to the Boltzmann equation; _V_j,0= -28.5 and 26.4 mV, _g_j,min= 0.15 and 0.14, z = 4.1 and 3.9 for negative and positive _V_j, respectively.
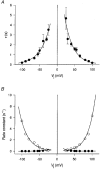
Figure 3. Kinetic analysis of junctional currents
A, plot of time constants of _I_j inactivation (τi) _versus V_j. Each symbol corresponds to a mean value ± 1
s.e.m.
Data from 8 cell pairs. The continuous curves represent the best fit of data to single exponentials; τi,0= 8.5 and 11.4 s and _V_τ= -27.4 and 24.4 mV for negative and positive _V_j values, respectively. B, plot of rate constants of channel opening, α (•), and channel closing, β (○), _versus V_j. The continuous curves correspond to the best fit of data to single exponentials; λ= 0.21 and 0.18, _A_α= -0.069 and 0.102, _A_β= -0.042 and 0.049, and _V_j,0= -24.1 and 27.8 mV for negative and positive _V_j values, respectively.
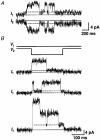
Figure 4. Single channel activity of a cell pair whose gap junction contained a single channel
A, sister current records documenting the de novo formation of a gap junction channel. _V_j was maintained at -40 mV. Simultaneous transitions in _I_1 and _I_2 reflect gap junction events (channel opening: upward deflections in _I_1, downward deflections in _I_2). The very first transition was slow and corresponds to the first opening after channel formation. The subsequent transitions were fast and represent channel flickering between the main state and the residual state (dashed lines). Continuous lines indicate the zero coupling current. B, single channel currents from a weakly coupled cell pair elicited by _V_j pulses (_V_1 and _V_2) of 50 mV (top and middle _I_1 trace) and 75 mV (bottom _I_1 trace). The coupling currents in the presence of one (top and middle _I_1 trace) and two channels (bottom _I_1 trace) exhibited fast transitions between the main state and the residual state.
Figure 5. Histogram of single channel conductances (γj) gained from cell pairs with a single gap junction channel
Data from 7 cell pairs were pooled in consecutive 5 pS bins. The number of observations was plotted _versus_γj. The continuous curves represent the best fit of data to Gaussians. The left-hand distribution revealed a mean value of 26.4 ± 0.5 pS (n = 53) and reflects the conductance of the incompletely closed channel, γj,residual. The right-hand distribution yielded a mean value of 163.2 ± 0.8 pS (n = 221) and corresponds to the conductance of the fully open channel, γj,main. Note that these experiments were carried out at 34-35 °C.
Figure 6. Influence of temperature on single channel conductances (γj)
Plots of single channel conductances γj,main (○) and γj,residual (•) on a logarithmic scale versus temperature. Symbols correspond to mean values ± 1
s.e.m.
obtained from 426 and 170 measurements for γj,main and γj,residual, respectively. Data were collected during application of _V_j pulses of 50 or 75 mV amplitude. Continuous lines were drawn by fitting the data to single exponentials. The temperature coefficients (_Q_10) for γj,main and γj,residual were 1.16 and 1.27, respectively.
Figure 7. Relationships between single channel conductances (γj) and transjunctional voltage (_V_j)
Plots of the single channel conductances γj,main (○) and γj,residual (•) _versus V_j. The symbols represent mean values obtained from 313 and 136 measurements, respectively; the bars for ± 1
s.e.m.
lay within the size of the symbols. Data derived from negative and positive _V_j were pooled. The continuous curves correspond to the best fit of data to equations derived from a mathematical model (for details, see text). Extrapolation to _V_j= 0 mV led to γj,main and γj,residual values of 146 and 34 pS, respectively.
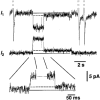
Figure 8. Comparison of fast and slow channel transitions
Sister current records _I_1 and _I_2 illustrating the re-opening of a gap junction channel previously closed by exposure to 75 μ
m
SKF-525A. _V_j was maintained at 50 mV (not shown). The first transition (closed state → main state) was slow (see inset at expanded time scale), the second transition (main state → residual state) was fast (see inset), and the third transition (residual state → closed state) was slow. The values of γj,main and γj,residual were 140 pS and 25 pS, respectively. The short transitions in _I_1 resulted from depolarising test pulses applied to cell 1. Continuous lines indicate zero current, dashed lines indicate residual current.
Figure 9. Effects of transjunctional voltage (_V_j) on single channel activity
Long-lasting segments of current records obtained from a cell pair with a single operational gap junction channel. The signals were recorded during steady-state conditions. Upward deflections correspond to channel openings. When _V_j was increased from 25 to 35, 40 and 55 mV (from top to bottom), the channel spent progressively less time in the main state and more time in the residual state (dashed lines). Continuous lines refer to the zero coupling current.
Figure 10. Dependence of main-state probability (_P_o,main) on transjunctional voltage (_V_j)
Values of _P_o,main were determined from long lasting current records (20-80 s) during steady-state conditions. The data were collected from cell pairs with a single operational gap junction channel. Data points represent mean values ± 1
s.e.m.
from 3 preparations. The continuous curve represents the best fit of data to the Boltzmann equation, with _V_j,0= 37.5 mV, _P_o,main= 0 and z = 3.
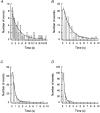
Figure 11. Histograms of channel open times
Current traces of cell pairs with a single gap junction channel were analysed for dwell times in the main state (i.e. channel open times) at different _V_j at steady state. The data from 3 cell pairs were sampled and plotted as frequency histograms. The continuous curves correspond to the best fit of data to single exponentials with the following time constants: A, τo= 4 s (_V_j= 10-25 mV); B, τo= 2 s (_V_j= 30-35 mV); C, τo= 0.67 s (_V_j= 40-45 mV); D, τo= 0.4 s (_V_j= 50-55 mV).
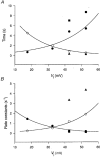
Figure 12. Steady-state kinetics of gap junction channels
A, values of channel mean open times (i.e. main state; ○) were determined from the probability density function using the rate constant of channel closure, β, and plotted _versus V_j. Likewise, values of channel mean closed times (i.e. residual state) were derived from the probability density function, with the rate constant of channel opening, α, and plotted _versus V_j. The histograms of the channel closed times were approximated with the sum of two exponentials. This gave rise to two values for the channel mean closed time (•, single exponential with τc; ▴, first exponential with τc1; ▪, second exponential with τc2). B, plots of the rate constants of channel opening, i.e. α (•), α1 (▴) and α2 (▪), and channel closing, i.e. β (○), versus V_j (data obtained from Fig. 12_A).
Similar articles
- Biophysical properties of gap junction channels formed by mouse connexin40 in induced pairs of transfected human HeLa cells.
Bukauskas FF, Elfgang C, Willecke K, Weingart R. Bukauskas FF, et al. Biophys J. 1995 Jun;68(6):2289-98. doi: 10.1016/S0006-3495(95)80411-X. Biophys J. 1995. PMID: 7544165 Free PMC article. - Voltage dependence of macroscopic and unitary currents of gap junction channels formed by mouse connexin50 expressed in rat neuroblastoma cells.
Srinivas M, Costa M, Gao Y, Fort A, Fishman GI, Spray DC. Srinivas M, et al. J Physiol. 1999 Jun 15;517 ( Pt 3)(Pt 3):673-89. doi: 10.1111/j.1469-7793.1999.0673s.x. J Physiol. 1999. PMID: 10358109 Free PMC article. - The electrical behaviour of rat connexin46 gap junction channels expressed in transfected HeLa cells.
Sakai R, Elfgang C, Vogel R, Willecke K, Weingart R. Sakai R, et al. Pflugers Arch. 2003 Sep;446(6):714-27. doi: 10.1007/s00424-003-1129-5. Epub 2003 Jul 12. Pflugers Arch. 2003. PMID: 12861414 - Emerging issues of connexin channels: biophysics fills the gap.
Harris AL. Harris AL. Q Rev Biophys. 2001 Aug;34(3):325-472. doi: 10.1017/s0033583501003705. Q Rev Biophys. 2001. PMID: 11838236 Review. - Gating of Connexin Channels by transjunctional-voltage: Conformations and models of open and closed states.
Bargiello TA, Oh S, Tang Q, Bargiello NK, Dowd TL, Kwon T. Bargiello TA, et al. Biochim Biophys Acta Biomembr. 2018 Jan;1860(1):22-39. doi: 10.1016/j.bbamem.2017.04.028. Epub 2017 May 2. Biochim Biophys Acta Biomembr. 2018. PMID: 28476631 Free PMC article. Review.
Cited by
- Coupling asymmetry of heterotypic connexin 45/ connexin 43-EGFP gap junctions: properties of fast and slow gating mechanisms.
Bukauskas FF, Angele AB, Verselis VK, Bennett MV. Bukauskas FF, et al. Proc Natl Acad Sci U S A. 2002 May 14;99(10):7113-8. doi: 10.1073/pnas.032062099. Proc Natl Acad Sci U S A. 2002. PMID: 12011467 Free PMC article. - Conductive and kinetic properties of connexin45 hemichannels expressed in transfected HeLa cells.
Bader P, Weingart R. Bader P, et al. J Membr Biol. 2004 Jun 1;199(3):143-54. doi: 10.1007/s00232-004-0682-y. J Membr Biol. 2004. PMID: 15457371 - Pitfalls when examining gap junction hemichannels: interference from volume-regulated anion channels.
Bader P, Weingart R. Bader P, et al. Pflugers Arch. 2006 Jul;452(4):396-406. doi: 10.1007/s00424-006-0046-9. Epub 2006 Apr 8. Pflugers Arch. 2006. PMID: 16604368 - Influence of dynamic gap junction resistance on impulse propagation in ventricular myocardium: a computer simulation study.
Henriquez AP, Vogel R, Muller-Borer BJ, Henriquez CS, Weingart R, Cascio WE. Henriquez AP, et al. Biophys J. 2001 Oct;81(4):2112-21. doi: 10.1016/S0006-3495(01)75859-6. Biophys J. 2001. PMID: 11566782 Free PMC article. - Connexins and gap junctions in the inner ear--it's not just about K⁺ recycling.
Jagger DJ, Forge A. Jagger DJ, et al. Cell Tissue Res. 2015 Jun;360(3):633-44. doi: 10.1007/s00441-014-2029-z. Epub 2014 Nov 9. Cell Tissue Res. 2015. PMID: 25381570 Free PMC article. Review.
References
- Banach K, Weingart R. Connexin43 gap junctions exhibit asymmetrical gating properties. Pflügers Archiv. 1996;431:775–785. - PubMed
- Brink PR, Ramanan SV, Christ GJ. Human connexin 43 gap junction channel gating: evidence for mode shifts and/or heterogeneity. American Journal of Physiology. 1996;271:C321–331. - PubMed
- Bruzzone R, White TW, Paul D. Connections with connexins: the molecular basis of direct intercellular signalling. European Journal of Biochemistry. 1996;238:1–27. - PubMed
- Bukauskas FF, Elfgang C, Willecke K, Weingart R. Heterotypic gap junction channels (connexin26-connexin32) violate the paradigm of unitary conductance. Pflügers Archiv. 1995b;429:870–872. - PubMed
Publication types
MeSH terms
Substances
LinkOut - more resources
Full Text Sources
Miscellaneous

