Synaptic control of glycine and GABA(A) receptors and gephyrin expression in cultured motoneurons - PubMed (original) (raw)
Synaptic control of glycine and GABA(A) receptors and gephyrin expression in cultured motoneurons
S Lévi et al. J Neurosci. 1999.
Abstract
We have evaluated the influence of the secretory phenotype of presynaptic boutons on the accumulation of postsynaptic glycine receptors (GlyRs), type A GABA receptors (GABA(A)Rs), and gephyrin clusters. The cellular distribution of these components was analyzed on motoneurons cultured either alone or with glycinergic and/or GABAergic neurons. In motoneurons cultured alone, we observed gephyrin clusters at nonsynaptic sites and in front of cholinergic boutons, whereas glycine and GABA(A) receptors formed nonsynaptic clusters. These receptors are functionally and pharmacologically similar to those found in cultures of all spinal neurons. Motoneurons receiving GABAergic innervation from dorsal root ganglia neurons displayed postsynaptic clusters of gephyrin and GABA(A)Rbeta but not of GlyRalpha/beta subunits. In motoneurons receiving glycinergic and GABAergic innervation from spinal interneurons, gephyrin, GlyRalpha/beta, and GABA(A)Rbeta formed mosaics at synaptic loci. These results indicate that (1) the transmitter phenotype of the presynaptic element determines the postsynaptic accumulation of specific receptors but not of gephyrin and (2) the postsynaptic accumulation of gephyrin alone cannot account for the formation of GlyR-rich microdomains.
Figures
Fig. 1.
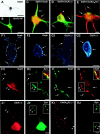
Gephyrin, GlyR, and GABAAR distribution on motoneurons cultured alone. A, Immunoperoxidase showing the nuclear staining of the embryonic motoneuronal marker Islet1. B, Double-staining of the dendritic protein MAP2 (green) and the axon-enriched 155 kDa neurofilament protein (red).C–E, Presence of clusters (arrows) of gephyrin (C, red), GlyRα/β (D, red), or GABAARβ3 (E, green) on MAP2-IR somato-dendritic compartment (green in C, D;red in E). GlyRα/β clusters are also accumulated at the level of axon-hillock (arrowhead in_D_). F, G, Confocal visualization of Geph-IR (F1–2) and GlyRα/β-IR (G1–2), respectively. Discontinuous Geph-IR (arrows) at the cell-to-substrate contact (F1) and at a distance from the coverslip (F2). GlyRα/β forms clusters at the cell-to-substrate contact (arrows in G1) and occasionally displays a continuous labeling (arrows in G2) on sections passing through the nucleus. H, I, Double-immunofluorescence showing that Geph-IR clusters (H1, I1) accumulate in front of synapsin-IR boutons (arrowheads in H2) displaying ChAT-IR (arrowheads in I2). Geph-IR clusters (H1, I1) are also detected at nonsynaptic sites (arrows). In contrast, GlyRα/β (J1) and GABAARβ2/3 (K1) do not concentrate at synaptic sites (arrowheads in J1–2 and_K1–2_, respectively). Insets in_H2, I2, J2,_ and K2 show superimposed images of H1–H2, I1–I2, J1–J2, and_K1–K2_, respectively. ChAT, Choline acetyltransferase;GABAAR_β_2/3, GABAARβ2/3 subunits-IR;GABAAR_β_3, GABAARβ3 subunits-IR; Geph, gephyrin-IR;_GlyR_α/β, GlyRα/β subunits-IR;MAP2, dendritic marker; NF, NF155 Kda-IR;Syn, synapsin-IR. Scale bar: A,B, 50 μm; C–K2, 10 μm.
Fig. 2.
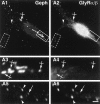
Simultaneous detection of gephyrin-IR (A1, A3, A5) and GlyRα/β-IR (A2, A4, A6) on motoneurons cultured alone for 7 DIV. Motoneurons display large and small, round-shaped Geph-IR clusters. Large Geph-IR clusters do not colocalize with GlyRα/β-IR (crossed arrows). Most (arrowheads) but not all (arrows) small Geph-IR clusters colocalize with GlyRα/β-IR clusters.Geph, Gephyrin-IR; _GlyR_α/β, GlyRα/β subunits-IR. A1–2, Pairs of digitized images acquired with CCD camera (A1, FITC channel;A2, TRITC channel). A3–4, A5–6, Higher magnification of the plain and dotted outlined regions in A1–2, respectively. Scale bar:A1–2, 10 μm; A3–4,A5–6, 1.2 μm.
Fig. 3.
Comparison of the functional and pharmacological properties of GlyRs in cultures of purified motoneurons and all spinal neurons. A–C, Concentration–response curves in both types of cultures (purified motoneurons: A,C, bars labeled MN; cultures of all spinal neurons: B, C, bars labeled_SN_). The internal solution and membrane potential were solution A and −20 mV (A–C, bars labeled_MN2_ and SN) or solution B and −70 mV(C, bars labeled MN1). The left traces in A or B show superimposed current recordings obtained during successive applications of glycine at increasing concentrations (10–160 μ
m
). The_right graph_ in A or B(obtained from the corresponding left traces) shows for each cell the fit of the concentration dependence of the peak response by a Hill equation: y =_I_max/(1 + (EC50/x)nH). The values and corresponding errors given by the computer for EC50, nH, and_I_max for each of these cells were, respectively, 46.7 ± 3.4 μ
m
, 1.92 ± 0.16 and 0.744 ± 0.035 nA in A, and 47.7 ± 0.9 μ
m
, 2.16 ± 0.06 and 0.833 ± 0.011 nA in_B. C_, Mean values and SD for these three parameters, derived from several such experiments performed in different cells under identical conditions. D, Voltage dependence of the responses of purified motoneurons to glycine (internal solution A). Glycine (10 μ
m
) was applied for 2 sec at different test potentials, using long voltage jumps from the holding potential (−20 mV) toward the test potential (the voltage jump beginning 0.8 sec before each glycine application). _Left graphs,_Normalized I–V curves for three different motoneurons, obtained by dividing each glycine response by the response of the corresponding cell at −60 mV. Right traces, Records obtained in one of these cells during voltage jumps to −80 and +80 mV.E, Strychnine sensitivity of glycine responses (internal solution A, holding potential −20 mV). Left panel, Mean values of the percentage of inhibition of the peak glycine responses by strychnine (50 or 500 n
m
applied with preincubation) in cultures of purified motoneurons (white bars) and in cultures of all spinal neurons (hatched bars). The glycine concentration was either 40 μ
m
(close to the EC50) or 100 μ
m
. Middle panel, Effect of strychnine applied with preincubation first at 50 n
m
, then at 500 n
m
, on the response to glycine (40 μ
m
) of a purified motoneuron (MN). Right panel, Effect of 500 n
m
strychnine, applied first without preincubation, then with preincubation, on the response to glycine (100 μ
m
) in a culture of all spinal neurons (SN).
Fig. 4.
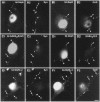
Gephyrin and GABAAR but not GlyR form postsynaptic clusters on motoneurons cocultured with DRG neurons. In all pairs of images, motoneurons are identified by the nuclear Islet1 staining. A, B, Geph-IR is concentrated in front of synapsin-IR boutons (arrowheads in A1–2) displaying GAD-IR (arrowheads in B1–2).C, D, GABAARβ2/3 accumulate at synaptic (arrowheads in C1–2) and nonsynaptic loci (crossed arrow in C1–2). Geph-IR clusters colocalize with GABAARβ3 clusters (arrowheads in D1–2). E, F, GlyRα/β (E1, F1) form clusters (arrowheads) that are not adjacent to synapsin-IR (E1–2, crossed arrows) or GAD-IR (F1–2, crossed arrows) boutons.GABAAR_β_2/3, GABAARβ2/3 subunits-IR;GABAAR_β_3, GABAARβ3 subunits-IR; GAD, GAD67-IR;Geph, gephyrin-IR, _GlyR_α/β, GlyRα/β subunits-IR; Isl, Islet1-IR;Syn, synapsin-IR. A1–A2, B1–B2, C1–C2, D1–D2, E1–E2, F1–F2, Pairs of digitized images acquired with CCD camera (A1, B1, C1, D1, E1, F1, TRITC channel;A2, B2, C2, D2, E2, F2, FITC channel). Scale bar, 10 μm.
Fig. 5.
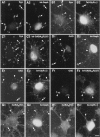
Gephyrin, GlyR, and GABAAR distribution on motoneurons cocultured with spinal neurons. In all pairs of images, motoneurons are identified by the nuclear Islet1 staining. A–C, Accumulation of Geph (A2), GlyRα/β (B2), and GABAARβ2/3 (C2) in front of most (arrowheads) but not all (crossed arrows) synapsin-IR boutons (A1, B1, C1). D–F, Double-staining of GAD (D1, E1, F1) and Geph (D2); GlyRα/β (E2) or GABAARβ2/3 (F2) show closely apposed signals (arrowheads). Some Geph and GlyRα/β spots are not adjacent to GAD-IR boutons (crossed arrows in_D1–2, E1–2_, respectively). G, H, Double-immunofluorescence showing that most GABAARβ3-IR spots (arrowheads in G1, H1) are associated with Geph-IR (G2) and GlyRα/β-IR (H2) clusters. Few Geph-IR clusters do not colocalize with GABAARβ3-IR (crossed arrows in_G1–2_).GABAAR_β_2/3, GABAARβ2/3 subunits-IR;GABAAR_β_3, GABAARβ3 subunits-IR; GAD, GAD67-IR;Geph, gephyrin-IR; _GlyR_α/β, GlyRα/β subunits-IR; Isl, Islet1-IR;Syn, synapsin-IR. A1–A2, B1–B2, C1–C2, D1–D2, E1–E2, F1–F2, G1–G2, H1–H2, Pairs of digitized images acquired with CCD camera (A1, B1, C1, D1, E1, F1, G1, H1, FITC channel; A2, B2, C2, D2, E2, F2, G2, H2, TRITC channel). Scale bar, 10 μm.
Fig. 6.
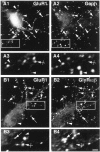
Comparison of GluR1-IR with gephyrin- or GlyRα/β-IR clusters on spinal interneurons. Spinal neurons immunolabeled at 11 DIV for GluR1 (A1, B1) and Geph (A2) or GlyRα/β (B2). Most Geph- or GlyRα/β-IR (arrowheads) and GluR1-IR (crossed arrows) do not colocalize. Few Geph- and GlyRα/β-IR clusters colocalized with GluR1-IR (arrows).Geph, gephyrin-IR; GluR1, glutamate receptor subunit GluR1; _GlyR_α/β, GlyRα/β subunits-IR. A1–A2, B1–B2, Pairs of digitized images acquired with CCD camera (A1, B1, FITC channel;A2, B2, TRITC channel). _A3–4, B3–4,_Higher magnification of a region outlined in A1–2, B1–2, respectively. Scale bar, A1–2, B1–2, 10 μm; A3–4, B3–4, 2.5 μm.
Fig. 7.
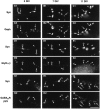
Relationships during in vitro_maturation of gephyrin, GlyR, and GABAAR with synaptic terminals on motoneurons cultured alone. Motoneurons double-stained for synapsin and gephyrin (A1–2, B1–2, C1–2), synapsin and GlyRα/β (D1–2, E1–2, F1–2), and synapsin and GABAARβ2/3 (G1–2, H1–2, I1–2) at 3, 7, and 11 DIV (left, middle, and_right columns, respectively). A–C, At 3 DIV, Geph-IR clusters accumulate in front of most but not all synaptic boutons. Numerous Geph-IR clusters are also detected at nonsynaptic loci. At 7 and 11 DIV, the number of postsynaptic Geph-IR clusters increased, and the number of nonsynaptic Geph-IR clusters decreased.D–F, At all stages, most GlyRα/β clusters are detected at nonsynaptic sites. G–I, At 3 and 7 DIV, few GABAARβ2/3 clusters are in front of synapsin-IR terminals. Their number increases at 11 DIV. Arrows, Apposed synapsin and postsynaptic markers (Geph, GlyRα/β, or GABAARβ2/3); crossed arrows, presence of synapsin-IR but not of the above-mentioned postsynaptic markers;arrowheads, presence of Geph-, GlyRα/β-, or GABAARβ2/3-IR clusters without adjacent synapsin-IR.GABAAR_β_2/3, GABAARβ2/3 subunits-IR; Geph, gephyrin-IR;_GlyR_α/β, GlyRα/β subunits-IR;Syn, synapsin-IR. A1–A2, B1–B2, C1–C2, D1–D2, E1–E2, F1–F2, G1–G2, H1–H2, I1–I, Pairs of digitized images acquired with CCD camera (A1, B1, C1, D1, E1, F1, G1, H1, I1, FITC channel; A2, B2, C2, D2, E2, F2, G2, H2, I2, TRITC channel). Scale bar, 10 μm.
Fig. 8.
Quantifications of the synaptic localization of gephyrin, GlyR, and GABAAR on motoneurons cultured alone (A1–3) or with spinal interneurons (B1–3). In each case, the open bars give the proportion of synapses with the indicated postsynaptic IR (Gephyrin, GlyR_α/β, or_GABAAR_β_2/3), and the filled bars give the proportion of nonsynaptic clusters per cell. Gephyrin, GlyRα/β, and GABAARβ2/3 clusters were classified as synaptic when adjacent to synapsin-IR. Results are means (± SEM) from 10–18 cells. The levels of significance (ANOVA, Scheffé F test) are indicated by one (p < 0.05), two (p < 0.01), or three (p < 0.001) symbols. ∉, Significance between 3 and 7 DIV; ¥, significance between 7 and 11 DIV; $, significance between 3 and 11 DIV.
Similar articles
- Formation of mixed glycine and GABAergic synapses in cultured spinal cord neurons.
Dumoulin A, Lévi S, Riveau B, Gasnier B, Triller A. Dumoulin A, et al. Eur J Neurosci. 2000 Nov;12(11):3883-92. doi: 10.1046/j.1460-9568.2000.00271.x. Eur J Neurosci. 2000. PMID: 11069583 - Glycine and GABA(A) receptor subunits on Renshaw cells: relationship with presynaptic neurotransmitters and postsynaptic gephyrin clusters.
Geiman EJ, Zheng W, Fritschy JM, Alvarez FJ. Geiman EJ, et al. J Comp Neurol. 2002 Mar 12;444(3):275-89. doi: 10.1002/cne.10148. J Comp Neurol. 2002. PMID: 11840480 - Loss of postsynaptic GABA(A) receptor clustering in gephyrin-deficient mice.
Kneussel M, Brandstätter JH, Laube B, Stahl S, Müller U, Betz H. Kneussel M, et al. J Neurosci. 1999 Nov 1;19(21):9289-97. doi: 10.1523/JNEUROSCI.19-21-09289.1999. J Neurosci. 1999. PMID: 10531433 Free PMC article. - Gephyrin: a master regulator of neuronal function?
Tyagarajan SK, Fritschy JM. Tyagarajan SK, et al. Nat Rev Neurosci. 2014 Mar;15(3):141-56. doi: 10.1038/nrn3670. Nat Rev Neurosci. 2014. PMID: 24552784 Review. - Mini-review: gephyrin, a major postsynaptic protein of GABAergic synapses.
Sassoè-Pognetto M, Fritschy JM. Sassoè-Pognetto M, et al. Eur J Neurosci. 2000 Jul;12(7):2205-10. doi: 10.1046/j.1460-9568.2000.00106.x. Eur J Neurosci. 2000. PMID: 10947798 Review.
Cited by
- Altered inhibitory synaptic transmission in superficial dorsal horn neurones in spastic and oscillator mice.
Graham BA, Schofield PR, Sah P, Callister RJ. Graham BA, et al. J Physiol. 2003 Sep 15;551(Pt 3):905-16. doi: 10.1113/jphysiol.2003.049064. Epub 2003 Jul 1. J Physiol. 2003. PMID: 12837931 Free PMC article. - Distribution of alpha1, alpha4, gamma2, and delta subunits of GABAA receptors in hippocampal granule cells.
Sun C, Sieghart W, Kapur J. Sun C, et al. Brain Res. 2004 Dec 17;1029(2):207-16. doi: 10.1016/j.brainres.2004.09.056. Brain Res. 2004. PMID: 15542076 Free PMC article. - Dynamics of glycine receptor insertion in the neuronal plasma membrane.
Rosenberg M, Meier J, Triller A, Vannier C. Rosenberg M, et al. J Neurosci. 2001 Jul 15;21(14):5036-44. doi: 10.1523/JNEUROSCI.21-14-05036.2001. J Neurosci. 2001. PMID: 11438579 Free PMC article. - Activity-dependent movements of postsynaptic scaffolds at inhibitory synapses.
Hanus C, Ehrensperger MV, Triller A. Hanus C, et al. J Neurosci. 2006 Apr 26;26(17):4586-95. doi: 10.1523/JNEUROSCI.5123-05.2006. J Neurosci. 2006. PMID: 16641238 Free PMC article. - GABAA receptor-mediated tonic depolarization in developing neural circuits.
Lu JC, Hsiao YT, Chiang CW, Wang CT. Lu JC, et al. Mol Neurobiol. 2014 Apr;49(2):702-23. doi: 10.1007/s12035-013-8548-x. Epub 2013 Sep 11. Mol Neurobiol. 2014. PMID: 24022163 Review.
References
- Alvarez FJ, Dewey DE, Harrington DA, Fyffe REW. Cell-type specific organization of glycine receptor clusters in the mammalian spinal cord. J Comp Neurol. 1997;379:150–170. - PubMed
- Baude A, Sequier JM, McKernan RM, Olivier KR, Somogyi P. Differential subcellular distribution of the α6 subunit versus the α1 and β2/3 subunits of the GABAA benzodiazepine receptor complex in granule cells of the cerebellar cortex. Neuroscience. 1992;51:739–748. - PubMed
Publication types
MeSH terms
Substances
LinkOut - more resources
Full Text Sources
