Vasopressin contributes to hyperfiltration, albuminuria, and renal hypertrophy in diabetes mellitus: study in vasopressin-deficient Brattleboro rats - PubMed (original) (raw)
Vasopressin contributes to hyperfiltration, albuminuria, and renal hypertrophy in diabetes mellitus: study in vasopressin-deficient Brattleboro rats
P Bardoux et al. Proc Natl Acad Sci U S A. 1999.
Abstract
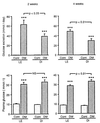
Diabetic nephropathy represents a major complication of diabetes mellitus (DM), and the origin of this complication is poorly understood. Vasopressin (VP), which is elevated in type I and type II DM, has been shown to increase glomerular filtration rate in normal rats and to contribute to progression of chronic renal failure in 5/6 nephrectomized rats. The present study was thus designed to evaluate whether VP contributes to the renal disorders of DM. Renal function was compared in Brattleboro rats with diabetes insipidus (DI) lacking VP and in normal Long-Evans (LE) rats, with or without streptozotocin-induced DM. Blood and urine were collected after 2 and 4 weeks of DM, and creatinine clearance, urinary glucose and albumin excretion, and kidney weight were measured. Plasma glucose increased 3-fold in DM rats of both strains, but glucose excretion was approximately 40% lower in DI-DM than in LE-DM, suggesting less intense metabolic disorders. Creatinine clearance increased significantly in LE-DM (P < 0.01) but failed to increase in DI-DM. Urinary albumin excretion more than doubled in LE-DM but rose by only 34% in DI-DM rats (P < 0.05). Kidney hypertrophy was also less intense in DI-DM than in LE-DM (P < 0.001). These results suggest that VP plays a critical role in diabetic hyperfiltration and albuminuria induced by DM. This hormone thus seems to be an additional risk factor for diabetic nephropathy and, thus, a potential target for prevention and/or therapeutic intervention.
Figures
Figure 1
Glucose excretion (top) and plasma glucose concentration (bottom) in Cont and diabetic (DM) rats with and without VP (LE and DI, respectively), 2 and 4 weeks after induction of DM. ANOVA followed by Fisher’s post hoc test: ∗∗∗, P < 0.001 DM vs. Cont in each strain.
Figure 2
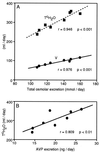
Relationship between V or TCH2O and total osmolar excretion (A) and relationship between free water reabsorption and VP excretion (B) in LE-DM rats 2 weeks after induction of DM. Linear regressions and correlation coefficients are shown.
Similar articles
- Vasopressin and diabetes mellitus.
Bankir L, Bardoux P, Ahloulay M. Bankir L, et al. Nephron. 2001 Jan;87(1):8-18. doi: 10.1159/000045879. Nephron. 2001. PMID: 11174021 Review. - Contribution of vasopressin to progression of chronic renal failure: study in Brattleboro rats.
Bouby N, Hassler C, Bankir L. Bouby N, et al. Life Sci. 1999;65(10):991-1004. doi: 10.1016/s0024-3205(99)00330-6. Life Sci. 1999. PMID: 10499867 - Vasopressin increases urinary albumin excretion in rats and humans: involvement of V2 receptors and the renin-angiotensin system.
Bardoux P, Bichet DG, Martin H, Gallois Y, Marre M, Arthus MF, Lonergan M, Ruel N, Bouby N, Bankir L. Bardoux P, et al. Nephrol Dial Transplant. 2003 Mar;18(3):497-506. doi: 10.1093/ndt/18.3.497. Nephrol Dial Transplant. 2003. PMID: 12584270 - Diabetes-induced albuminuria: role of antidiuretic hormone as revealed by chronic V2 receptor antagonism in rats.
Bardoux P, Bruneval P, Heudes D, Bouby N, Bankir L. Bardoux P, et al. Nephrol Dial Transplant. 2003 Sep;18(9):1755-63. doi: 10.1093/ndt/gfg277. Nephrol Dial Transplant. 2003. PMID: 12937221 - Hyperfiltration and diabetic nephropathy: is it the beginning? Or is it the end?
Castellino P, Shohat J, DeFronzo RA. Castellino P, et al. Semin Nephrol. 1990 May;10(3):228-41. Semin Nephrol. 1990. PMID: 2190280 Review.
Cited by
- Metabolic and Kidney Diseases in the Setting of Climate Change, Water Shortage, and Survival Factors.
Johnson RJ, Stenvinkel P, Jensen T, Lanaspa MA, Roncal C, Song Z, Bankir L, Sánchez-Lozada LG. Johnson RJ, et al. J Am Soc Nephrol. 2016 Aug;27(8):2247-56. doi: 10.1681/ASN.2015121314. Epub 2016 Jun 9. J Am Soc Nephrol. 2016. PMID: 27283495 Free PMC article. - Daily fluid intake and outcomes in kidney recipients: post hoc analysis from the randomized ABCAN trial.
Weber M, Berglund D, Reule S, Jackson S, Matas AJ, Ibrahim HN. Weber M, et al. Clin Transplant. 2015 Mar;29(3):261-7. doi: 10.1111/ctr.12514. Clin Transplant. 2015. PMID: 25619874 Free PMC article. - Renal response to an oral protein load in patients with central diabetes insipidus before and after treatment with vasopressin.
Viggiano D, De Santo NG, Amruthraj NJ, Capolongo G, Capasso G, Anastasio P. Viggiano D, et al. J Nephrol. 2019 Jun;32(3):411-415. doi: 10.1007/s40620-018-00575-x. Epub 2019 Feb 19. J Nephrol. 2019. PMID: 30778919 - Copeptin as a Biomarker of Atherosclerosis in Type 1 Diabetic Patients.
El Dayem SMA, Battah AA, El Bohy AEM, Yousef RN, Talaat A. El Dayem SMA, et al. Open Access Maced J Med Sci. 2020 Dec 13;7(23):3975-3978. doi: 10.3889/oamjms.2019.643. eCollection 2019 Dec 15. Open Access Maced J Med Sci. 2020. PMID: 33318769 Free PMC article. - Preservation of kidney function irrelevant of total kidney volume growth rate with tolvaptan treatment in patients with autosomal dominant polycystic kidney disease.
Horie S, Muto S, Kawano H, Okada T, Shibasaki Y, Nakajima K, Ibuki T. Horie S, et al. Clin Exp Nephrol. 2021 May;25(5):467-478. doi: 10.1007/s10157-020-02009-0. Epub 2021 Jan 20. Clin Exp Nephrol. 2021. PMID: 33471240 Free PMC article. Clinical Trial.
References
- American Diabetes Association. Diabetes Care. 1998;21:S50–S53.
- Zerbe R L, Vinicor F, Robertson G L. Diabetes. 1979;28:503–508. - PubMed
- Iwasaki Y, Kondo K, Murase T, Hasegawa H, Oiso Y. J Neuroendocrinol. 1996;8:755–760. - PubMed
- Kamoi K, Ishibashi M, Yamaji T. Diabetes Res Clin Pract. 1991;11:195–202. - PubMed
- Tallroth G, Ryding E, Ekman R, Agardh C D. Diabetes Res. 1992;20:73–85. - PubMed
MeSH terms
Substances
LinkOut - more resources
Full Text Sources
Other Literature Sources
Medical

