Distribution of bacterial growth activity in flow-chamber biofilms - PubMed (original) (raw)
Distribution of bacterial growth activity in flow-chamber biofilms
C Sternberg et al. Appl Environ Microbiol. 1999 Sep.
Abstract
In microbial communities such as those found in biofilms, individual organisms most often display heterogeneous behavior with respect to their metabolic activity, growth status, gene expression pattern, etc. In that context, a novel reporter system for monitoring of cellular growth activity has been designed. It comprises a transposon cassette carrying fusions between the growth rate-regulated Escherichia coli rrnBP1 promoter and different variant gfp genes. It is shown that the P1 promoter is regulated in the same way in E. coli and Pseudomonas putida, making it useful for monitoring of growth activity in organisms outside the group of enteric bacteria. Construction of fusions to genes encoding unstable Gfp proteins opened up the possibility of the monitoring of rates of rRNA synthesis and, in this way, allowing on-line determination of the distribution of growth activity in a complex community. With the use of these reporter tools, it is demonstrated that individual cells of a toluene-degrading P. putida strain growing in a benzyl alcohol-supplemented biofilm have different levels of growth activity which develop as the biofilm gets older. Cells that eventually grow very slowly or not at all may be stimulated to restart growth if provided with a more easily metabolizable carbon source. Thus, the dynamics of biofilm growth activity has been tracked to the level of individual cells, cell clusters, and microcolonies.
Figures
FIG. 1
Schematic representation of plasmid SM1690 and the resulting transposon delivery plasmid pSM1695. The organization of relevant regions in the _rrnB_P1-_gfp_mut3b* cassette, as well as regions of the delivery plasmid, is shown. _rrnB_P1, 72-bp ribosomal promoter; _gfp_mut3b*, Gfp marker gene; RBSII, synthetic ribosomal binding site; Stop, stop codon in all three reading frames; T0 and T1, termination sites; I and O, 19-bp transposon inverted repeats; npt, gene encoding kanamycin resistance. Relevant restriction sites: N, _Not_I; Sa, _Sac_I; X, _Xba_I; S, _Sph_I; B, _Bam_HI; H, _Hin_dIII. Note that the _rrnB_P1-_gfp_mut3b* cassette is inserted into the _Not_I site of the delivery vector in an orientation that prevents readthrough from chromosomal promoters located adjacent to the transposon insertion in the host chromosome.
FIG. 2
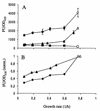
(A) Variation in fluorescence intensity [wt] as a function of growth rate of strains JB156 (wild-type [wt] P. putida R1 [Nalr]; ■), SM1699 (P. putida R1::P_rrnB_P1-_gfp_mut3b* wt; ●), and SM1639 [P. putida R1::P_rrnB_P1-gfp(AAV); ▴]. The growth rate was varied by growing cells in chemostats at different dilution rates (closed symbols) and exponentially in batch cultures (open symbols). Each point is the average of at least three independent measurements. Error bars indicate standard deviations. (B) Fluorescence intensity of strain SM1699 with the background from JB156 subtracted (⧫) compared with the fluorescence intensities of 16S rRNA hybridizations of wt P. putida R1 (JB156) cells (▴). Fluorescence intensity is normalized to 1 for cells grown in batch cultures. The ordinate axes are the same in panels A and B. FU, fluorescence units.
FIG. 3
Energy exhaustion experiments demonstrating growth phase-dependent expression of the _rrnB_P1 promoter. Cells were grown in AB minimal medium with sodium citrate as the limiting energy source. Symbols: ■, JM156 (wild-type P. putida R1); ●, SM1699 (P. putida R1::P_rrnB_P1-_gfp_mut3b*); ▴, SM1639 [P. putida R1::P_rrnB_P1-gfp(AAV)]. Panels: A, fluorescence units (FU) per OD450 unit of the three strains; B, growth curves. The ordinate axes are the same in panels A and B.
FIG. 4
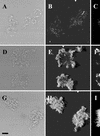
Demonstration of microbial growth activity in flow chamber monoculture biofilms. Comparison of different monitor strains. The panels represent flow chamber biofilms with the following strains: A, B, and C, JM156 (P. putida R1 [Nalr]); D, E, and F, SM1639 [P. putida R1::P_rrnB_P1-gfp(AAV)]; G, H, and I, SM1699 (P. putida R1::P_rrnB_P1-_gfp_mut3b*). Panels A, D, and G are bright-field images. Panels B, E, and H are SCLM images of the green fluorescent cells presented as simulated fluorescent projections where a long shadow indicates a large, high microcolony. Panels C, F, and I are vertical sections through the biofilm collected at positions indicated by the white triangles. The substratum is located at the left edge of panels C, F, and I. Vertical sections are included to provide information on vertical microcolony size. All images were recorded with the same SCLM settings, i.e., the same laser power and PMT setting. The bar indicates 10 μm, and the scale applies to all of the panels.
FIG. 5
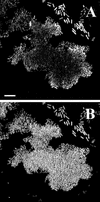
Comparison of microbial activity in flow chamber biofilms monitored either as green fluorescence [Gfp(AAV) expression] emitted from strain SM1639 (P. putida R1::_rrnB_P1-gfp(AAV)] or by fluorescent rRNA hybridization of the same biofilm cells. Approximately 20 h after initial colonization of a flow chamber, the biofilm was fixed and embedded. The oligonucleotide probe PP986 labeled with CY3 was used for the hybridizations. Panel A represents Gfp(AAV) expression and panel B represents the hybridization signal in a horizontal SCLM cross section of the glass surface-attached cells in such an embedded biofilm. Bar, 10 μm.
FIG. 6
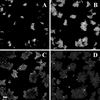
On-line monitoring of establishment and changes in microbial activity in a flow chamber biofilm consisting of SM1639 [P. putida R1::P_rrnB_P1-gfp(AAV)]. The fluorescent signals emitted by the cells were visualized with SCLM. The images in panels A to D were recorded at the same flow chamber position 12, 17, 20, and 24.5 h after inoculation, respectively. Each image is presented as a horizontal cross section through a microcolony of cells located at the glass surface in the flow chamber. All images were recorded with the same SCLM setting. Bar, 10 μm.
FIG. 7
Effect of upshift in a P. putida R1::P_rrnB_P1-gfp(AAV) biofilm in a flow cell. Microcolonies were observed by SCLM. Biofilms were established and grown in AB minimal medium supplemented with 0.5 mM benzyl alcohol. A to E, 19, 23, 25, 26, and 28 h after inoculation, respectively; F, bright-field image of the same spot as shown in panel E. At 20 h, the medium was changed to FAB supplemented with 4 mM sodium citrate. Images were recorded as described in the legend to Fig. 6. Bar, 10 μm.
Similar articles
- Bacterial activity in the rhizosphere analyzed at the single-cell level by monitoring ribosome contents and synthesis rates.
Ramos C, Mølbak L, Molin S. Ramos C, et al. Appl Environ Microbiol. 2000 Feb;66(2):801-9. doi: 10.1128/AEM.66.2.801-809.2000. Appl Environ Microbiol. 2000. PMID: 10653754 Free PMC article. - Metabolic commensalism and competition in a two-species microbial consortium.
Christensen BB, Haagensen JA, Heydorn A, Molin S. Christensen BB, et al. Appl Environ Microbiol. 2002 May;68(5):2495-502. doi: 10.1128/AEM.68.5.2495-2502.2002. Appl Environ Microbiol. 2002. PMID: 11976126 Free PMC article. - Establishment of new genetic traits in a microbial biofilm community.
Christensen BB, Sternberg C, Andersen JB, Eberl L, Moller S, Givskov M, Molin S. Christensen BB, et al. Appl Environ Microbiol. 1998 Jun;64(6):2247-55. doi: 10.1128/AEM.64.6.2247-2255.1998. Appl Environ Microbiol. 1998. PMID: 9603843 Free PMC article. - In situ gene expression in mixed-culture biofilms: evidence of metabolic interactions between community members.
Møller S, Sternberg C, Andersen JB, Christensen BB, Ramos JL, Givskov M, Molin S. Møller S, et al. Appl Environ Microbiol. 1998 Feb;64(2):721-32. doi: 10.1128/AEM.64.2.721-732.1998. Appl Environ Microbiol. 1998. PMID: 9464414 Free PMC article. - Dynamics of development and dispersal in sessile microbial communities: examples from Pseudomonas aeruginosa and Pseudomonas putida model biofilms.
Klausen M, Gjermansen M, Kreft JU, Tolker-Nielsen T. Klausen M, et al. FEMS Microbiol Lett. 2006 Aug;261(1):1-11. doi: 10.1111/j.1574-6968.2006.00280.x. FEMS Microbiol Lett. 2006. PMID: 16842351 Review.
Cited by
- Biofilm as a production platform for heterologous production of rhamnolipids by the non-pathogenic strain Pseudomonas putida KT2440.
Wigneswaran V, Nielsen KF, Sternberg C, Jensen PR, Folkesson A, Jelsbak L. Wigneswaran V, et al. Microb Cell Fact. 2016 Oct 24;15(1):181. doi: 10.1186/s12934-016-0581-9. Microb Cell Fact. 2016. PMID: 27776509 Free PMC article. - Horizontal gene transfer in the phytosphere.
Van Elsas JD, Turner S, Bailey MJ. Van Elsas JD, et al. New Phytol. 2003 Mar;157(3):525-537. doi: 10.1046/j.1469-8137.2003.00697.x. New Phytol. 2003. PMID: 33873398 Review. - gfp-based N-acyl homoserine-lactone sensor systems for detection of bacterial communication.
Andersen JB, Heydorn A, Hentzer M, Eberl L, Geisenberger O, Christensen BB, Molin S, Givskov M. Andersen JB, et al. Appl Environ Microbiol. 2001 Feb;67(2):575-85. doi: 10.1128/AEM.67.2.575-585.2001. Appl Environ Microbiol. 2001. PMID: 11157219 Free PMC article. - In situ growth rates and biofilm development of Pseudomonas aeruginosa populations in chronic lung infections.
Yang L, Haagensen JA, Jelsbak L, Johansen HK, Sternberg C, Høiby N, Molin S. Yang L, et al. J Bacteriol. 2008 Apr;190(8):2767-76. doi: 10.1128/JB.01581-07. Epub 2007 Dec 21. J Bacteriol. 2008. PMID: 18156255 Free PMC article. - Induction of rapid detachment in Shewanella oneidensis MR-1 biofilms.
Thormann KM, Saville RM, Shukla S, Spormann AM. Thormann KM, et al. J Bacteriol. 2005 Feb;187(3):1014-21. doi: 10.1128/JB.187.3.1014-1021.2005. J Bacteriol. 2005. PMID: 15659679 Free PMC article.
References
- Boyer H W, Roulland-Dussoix D. A complementation analysis of the restriction and modification of DNA in Escherichia coli. J Mol Biol. 1969;41:459. - PubMed
Publication types
MeSH terms
Substances
LinkOut - more resources
Full Text Sources


