Human BUBR1 is a mitotic checkpoint kinase that monitors CENP-E functions at kinetochores and binds the cyclosome/APC - PubMed (original) (raw)
Human BUBR1 is a mitotic checkpoint kinase that monitors CENP-E functions at kinetochores and binds the cyclosome/APC
G K Chan et al. J Cell Biol. 1999.
Abstract
Human cells express two kinases that are related to the yeast mitotic checkpoint kinase BUB1. hBUB1 and hBUBR1 bind to kinetochores where they are postulated to be components of the mitotic checkpoint that monitors kinetochore activities to determine if chromosomes have achieved alignment at the spindle equator (Jablonski, S.A., G.K.T. Chan, C.A. Cooke, W.C. Earnshaw, and T.J. Yen. 1998. Chromosoma. 107:386-396). In support of this, hBUB1 and the homologous mouse BUB1 have been shown to be important for the mitotic checkpoint (Cahill, D.P., C. Lengauer, J. Yu, G.J. Riggins, J.K. Willson, S.D. Markowitz, K.W. Kinzler, and B. Vogelstein. 1998. Nature. 392:300-303; Taylor, S.S., and F. McKeon. 1997. Cell. 89:727-735). We now demonstrate that hBUBR1 is also an essential component of the mitotic checkpoint. hBUBR1 is required by cells that are exposed to microtubule inhibitors to arrest in mitosis. Additionally, hBUBR1 is essential for normal mitotic progression as it prevents cells from prematurely entering anaphase. We establish that one of hBUBR1's checkpoint functions is to monitor kinetochore activities that depend on the kinetochore motor CENP-E. hBUBR1 is expressed throughout the cell cycle, but its kinase activity is detected after cells have entered mitosis. hBUBR1 kinase activity was rapidly stimulated when the spindle was disrupted in mitotic cells. Finally, hBUBR1 was associated with the cyclosome/anaphase-promoting complex (APC) in mitotically arrested cells but not in interphase cells. The combined data indicate that hBUBR1 can potentially provide two checkpoint functions by monitoring CENP-E-dependent activities at the kinetochore and regulating cyclosome/APC activity.
Figures
Figure 1
hBUBR1 is essential for cells to arrest in mitosis in the presence of nocodazole. (A) Immunofluorescence staining of Hela cells injected with antibodies and exposed to nocodazole. (row 1 and 2) 12 h after release from the G1/S boundary, nonimmune– and hBUBR1 antibody–injected cells have entered mitosis in the presence of nocodazole with unaligned chromosomes (left). Injected antibodies were visualized with Cy5 anti-rabbit secondary antibodies (middle) and endogenous hBUBR1 was visualized with a rat anti–hBUBR1 antibody and Cy2 anti-rat secondary antibodies (right). (row 3) Cells injected with hBUBR1 (middle) exited mitosis in the presence of nocodazole and formed aberrantly shaped nuclei (left) that contained paired centromeres as determined by ACA and Cy2 anti-human secondary antibody staining (right, arrowheads in the inset). Chromosomes and nuclei were visualized by DAPI staining (left). Images in rows 1 and 2 were captured with a 100× objective, whereas row 3 was visualized with a 40× objective. (B) Histogram comparing the fates of Hela cells injected with nonimmune or hBUBR1 antibodies after exposure to nocodazole. Synchronized Hela cells were injected within 2 h after their release from the G1/S boundary, nocodazole was added 8 h after release from the G1/S boundary and sampled 4, 6, and 8 h later. Hela cells normally enter mitosis between 10–12 h after release from the G1/S boundary. The histogram compares the mitotic (open bars), multi-nucleated (striped bars), and apoptotic (dotted bars) indices of cells injected with hBUBR1 and nonimmune antibodies at 16 h after release from the G1/S boundary. Approximately 80–120 injected cells were counted for each experiment. The plotted values are the means plus SD from at least three experiments. (C) A single cell microinjected with hBUBR1 antibodies and incubated in the presence of nocodazole was followed by time-lapse videomicroscopy shortly after it entered mitosis (time 0). Frames were selected from a 4.5-h long time-lapse experiment. Actual time in minutes is labeled in the bottom right corners of each frame. Bars, 10 μm.
Figure 2
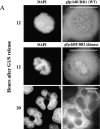
Overexpression of a hBUBR1Δkinase prevents cells from arresting in mitosis in the presence of nocodazole. (A; rows 1 and 2) 12 h after release from the G1/S boundary, cells expressing gfp:hBUBR1 (WT) and the gfp:hBUBR1Δkinase mutant enter mitosis in the presence of nocodazole. Both the gfp:hBUBR1 (WT) and the gfp:hBUBR1Δkinase mutant were concentrated at kinetochores (right). (row 3) After overnight incubation in nocodazole, cells that expressed the gfp:hBUBR1Δkinase mutant had exited mitosis and formed aberrantly shaped nuclei (left). Gfp:fusion constructs were directly visualized by autofluorescence. Chromosomes and nuclei were visualized with DAPI. (B) Fates of Hela cells that expressed wild-type gfp:hBUBR1 or gfp:hBUBR1Δkinase and exposed to nocodazole. Synchronized Hela cells were transfected ∼2 h after release from the G1/S boundary with wild-type gfp:hBUBR1 or gfp:hBUBR1Δkinase; after 5 h, the transfection mix was removed and nocodazole was added. The mitotic (open bars), multinucleated (striped bars), and apoptotic (dotted bars) indices of wild-type gfp:hBUBR1 and gfp:hBUBR1Δkinase after overnight incubation (∼20 h after release from the G1/S boundary) in nocodazole was compared. Approximately 120–150 transfected cells were counted and scored for each experiment. The plotted values are the means plus SD from at least three experiments. Bars, 10 μm.
Figure 3
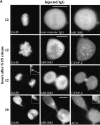
hBUBR1 is essential for cells to proceed normally through mitosis. (A) Synchronized Hela cells released from the G1/S boundary were injected with nonimmune or hBUBR1 antibodies and sampled at 12 or 16 h later. (rows 1–3) 12 h after release from the G1/S boundary, injected cells entered mitosis. (row 1) Metaphase cell injected with nonimmune IgG (middle) stained for endogenous hBUBR1 (right). (rows 2 and 3) Prometaphase and anaphase cells injected with hBUBR1 antibodies (middle) and stained for CENP-E (right). (row 4) 16 h after release from the G1/S boundary, hBUBR1 injected cells (middle) divided with lagging chromosomes trapped in the cleavage furrow. Centromeres (arrowheads) stained with ACA and visualized with Texas red anti-human secondary antibodies. Insets in rows 3 and 4 are longer exposures and enlargements of boxed areas. Injected antibodies were visualized with Cy5 anti-rabbit secondary antibody (middle). Endogenous hBUBR1 was stained with rat anti–hBUBR1 and detected with Cy2 anti-rat (row 1, right). CENP-E was stained with mouse monoclonal anti-CENP-E (mAb177) and detected with Cy2 anti-mouse secondary antibodies (rows 2 and 3, right). Chromosomes and nuclei were stained with DAPI (left). (B) 16 h after release from the G1/S boundary, nonimmune IgG– and hBUBR1 antibody–injected cells were scored for mitotic (open bar), normal telophase (dotted bar) or aberrantly divided cut (checkered bar) based on a combination of DAPI staining and phase-contrast images. Histogram compares relative percentages of each of the three phenotypes. The plotted values are the means plus SD from at least three experiments. (C) Cells expressing gfp:hBUBR1Δkinase exit mitosis with prematurely. Synchronized Hela cells transfected with gfp:hBUBR1Δkinase enter mitosis (top row) 12 h after release from the G1/S boundary. By 16 h, most cells expressing the kinase mutant produced cells that divided with lagging chromosomes trapped in the cleavage furrow (bottom). Bars, 10 μm.
Figure 4
hBUBR1 is required for mitotic arrest resulting from loss of CENP-E functions at kinetochores. Synchronized Hela cells were injected with rabbit anti–CENP-E and hBUBR1 antibodies and sampled at 12 or 16 h after release from the G1/S boundary. (A) Immunofluorescence staining of injected cells at these time points. (left gallery) Cells injected with CENP-E antibodies arrest in mitosis with unaligned chromosomes. Cells were stained for the injected CENP-E antibodies (middle), localization of endogenous hBUBR1, ACA, and tubulin (rows 1–3, respectively, right). (right gallery) Cells coinjected with CENP-E and hBUBR1 antibodies (middle) enter mitosis with hBUBR1 at kinetochores (right, row 1). At the 16-h time points (rows 2 and 3), the cells coinjected with CENP-E and hBUBR1 antibodies exit mitosis with unaligned chromosomes to produce divided cells with lagging chromosomes (inset in left) and multiple nuclei that reform around unsegregated or incompletely separated chromosomes. Phase-contrast image show cells were tethered at the stembody (row 2, right). Injected antibodies were stained with Cy5 anti-rabbit secondary antibodies (middle columns of both galleries). Endogenous hBUBR1 was stained with anti-rat hBUBR1 and visualized with Cy2 anti-rat secondary antibody. ACA was visualized with Cy2 anti-human secondary antibodies. Microtubules were detected with antitubulin mAbs and Cy2 anti-mouse secondary antibodies. Chromosomes and nuclei were stained with DAPI (left column). (B) Comparison of the fates of cells injected with CENP-E antibodies, hBUBR1+CENP-E antibodies, and nonimmune IgG. After cells were released from the G1/S boundary for 16 h, the percentage of cells injected with the various antibodies that were in mitosis (open bars), normal telophase (white dotted bar), cut (checkered bar), and apoptosis (black dotted bar) were quantitated and compared. The plotted values are the means plus SDs from at least three experiments. Bars, 10 μm.
Figure 5
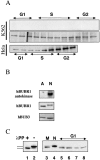
hBUBR1 expression, phosphorylation, and kinase activity during the cell cycle. (A) K562 and Hela cells were separated according to their position in the cell cycle by centrifugal elutriation. hBUBR1 was immunoprecipitated from equal amounts of protein from each fraction, and then tested for autokinase activity (top) or probed with hBUBR1 antibodies to compare its cell cycle expression profile (middle and bottom). (B) Comparison of autokinase activity (top) and levels of hBUBR1 (middle) and hBUB3 found in hBUBR1 immunoprecipitates from asynchronous interphase cells (A) or cells blocked in mitosis by nocodazole (N). (C) hBUBR1 is hyperphosphorylated in mitosis. hBUBR1 immunoprecipitated from mitotically blocked Hela cells were incubated in the presence (lane 1) or absence (lane 2) of lambda protein phosphatase (λPP). (lanes 3–8) Comparison of hyperphosphorylation status of hBUBR1 in normal mitotic Hela cells (lane 3, M), nocodazole-blocked mitotic cells (lane 4, N), or cells released from the nocodazole block for 1, 2, 3, and 4 h (lanes 5–8, respectively). Cells were determined to have reentered G1 by phase-contrast microscopy.
Figure 6
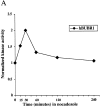
hBUBR1 kinase in metaphase Hela cells are stimulated by disruption of the spindle. Mitotic shakeoff cells that were nearly uniformly at metaphase were exposed to nocodazole for the times indicated and hBUBR1 complexes were immunoprecipitated from cell lysates and probed for autokinase activity. (A) hBUBR1 autokinase activity from each time point was quantitated with a PhosphorImager and normalized to metaphase cells (time 0). This is a valid comparison as equal amounts of hBUBR1 were used for the kinase assay. (B) Western blots of hBUBR1 immunoprecipitates probed with hBUBR1 (top) and hBUB3 (middle). Lysates obtained from the same experiment were separately probed for cyclin B expression (bottom). (C) Western blot of the insoluble chromosome fractions obtained from the experiment described above was probed for hBUBR1.
Figure 7
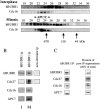
hBUBR1 associates with the cyclosome/APC during mitosis. (A) Lysates prepared from Hela cells enriched in G1 by centrifugal elutriation (interphase) or blocked in mitosis with nocodazole were separated on a Superose 6 column by FPLC. Individual fractions were probed with hBUBR1 antibodies (top) and hscdc16 antibodies (bottom). Fractions 21–25 contain the cyclosome/APC as determined by size markers and presence of cyclosome/APC subunits, hscdc16 (bottom), hscdc27, and APC7 (not shown). The column was calibrated with three different size markers as indicated by the arrows. (B) Fractions 21–25 from the interphase and mitotic gel filtration columns that contained peak levels of cyclosome/APC were pooled and immunoprecipitated with hBUBR1 antibodies (left and middle columns) or nonimmune antibodies (right column, mitotic samples only). Immunoprecipitates were probed with antibodies to hBUBR1 and three different cyclosome/APC subunits. (C) hBUBR1 immunoprecipitates from nocodazole-blocked mitotic Hela lysates were probed for hBUBR1, and the cyclosome/APC subunits hscdc27, hscdc16, and APC7. 20% of the remaining supernatant (after removal of the IP) was also probed for the presence of these proteins by Western blots. Samples were probed at the same time and exposed to film for identical times. Exposures were chosen that had not saturated the film. Relative band intensities were estimated. For example, the Western blots indicated that there was approximately twice the amount of hBUBR1 in the IP than in the supernatant. Taking into consideration that the hBUBR1 signal in the supernatant represented only one fifth of the input, the ratio of hBUBR1 between IP and supernatant was ∼2:5. From this ratio, we calculated that 28% of the total pool of hBUBR1 was found in the IP. The broad cdc27 bands in the mitotic samples has been shown to be hyperphosphorylation (Yu et al. 1998).
Similar articles
- Characterization of the kinetochore binding domain of CENP-E reveals interactions with the kinetochore proteins CENP-F and hBUBR1.
Chan GK, Schaar BT, Yen TJ. Chan GK, et al. J Cell Biol. 1998 Oct 5;143(1):49-63. doi: 10.1083/jcb.143.1.49. J Cell Biol. 1998. PMID: 9763420 Free PMC article. - Bub1 and aurora B cooperate to maintain BubR1-mediated inhibition of APC/CCdc20.
Morrow CJ, Tighe A, Johnson VL, Scott MI, Ditchfield C, Taylor SS. Morrow CJ, et al. J Cell Sci. 2005 Aug 15;118(Pt 16):3639-52. doi: 10.1242/jcs.02487. Epub 2005 Jul 26. J Cell Sci. 2005. PMID: 16046481 - The hBUB1 and hBUBR1 kinases sequentially assemble onto kinetochores during prophase with hBUBR1 concentrating at the kinetochore plates in mitosis.
Jablonski SA, Chan GK, Cooke CA, Earnshaw WC, Yen TJ. Jablonski SA, et al. Chromosoma. 1998 Dec;107(6-7):386-96. doi: 10.1007/s004120050322. Chromosoma. 1998. PMID: 9914370 - The mitotic checkpoint: a signaling pathway that allows a single unattached kinetochore to inhibit mitotic exit.
Chan GK, Yen TJ. Chan GK, et al. Prog Cell Cycle Res. 2003;5:431-9. Prog Cell Cycle Res. 2003. PMID: 14593737 Review. - A new view of the spindle checkpoint.
Hoyt MA. Hoyt MA. J Cell Biol. 2001 Sep 3;154(5):909-11. doi: 10.1083/jcb.200108010. J Cell Biol. 2001. PMID: 11535614 Free PMC article. Review.
Cited by
- Suppression of genomic instabilities caused by chromosome mis-segregation: a perspective from studying BubR1 and Sgo1.
Dai W. Dai W. J Formos Med Assoc. 2009 Dec;108(12):904-11. doi: 10.1016/S0929-6646(10)60002-2. J Formos Med Assoc. 2009. PMID: 20040454 Free PMC article. Review. - BubR1 and APC/EB1 cooperate to maintain metaphase chromosome alignment.
Zhang J, Ahmad S, Mao Y. Zhang J, et al. J Cell Biol. 2007 Aug 27;178(5):773-84. doi: 10.1083/jcb.200702138. Epub 2007 Aug 20. J Cell Biol. 2007. PMID: 17709426 Free PMC article. - Phosphorylation controls spatial and temporal activities of motor-PRC1 complexes to complete mitosis.
Gluszek-Kustusz A, Craske B, Legal T, McHugh T, Welburn JP. Gluszek-Kustusz A, et al. EMBO J. 2023 Nov 2;42(21):e113647. doi: 10.15252/embj.2023113647. Epub 2023 Aug 18. EMBO J. 2023. PMID: 37592895 Free PMC article. - Leaving no-one behind: how CENP-E facilitates chromosome alignment.
Craske B, Welburn JPI. Craske B, et al. Essays Biochem. 2020 Sep 4;64(2):313-324. doi: 10.1042/EBC20190073. Essays Biochem. 2020. PMID: 32347304 Free PMC article. Review. - Defects in chromosome congression and mitotic progression in KIF18A-deficient cells are partly mediated through impaired functions of CENP-E.
Huang Y, Yao Y, Xu HZ, Wang ZG, Lu L, Dai W. Huang Y, et al. Cell Cycle. 2009 Aug 15;8(16):2643-9. doi: 10.4161/cc.8.16.9366. Epub 2009 Aug 29. Cell Cycle. 2009. PMID: 19625775 Free PMC article.
References
- Basu J., Logarinho E., Herrmann S., Bousbaa H., Li Z., Chan G.K., Yen T.J., Sunkel C.E., Goldberg M.L. Localization of the Drosophila checkpoint control protein Bub3 to the kinetochore requires Bub1 but not Zw10 or Rod. Chromosoma. 1998;107:376–385. - PubMed
- Cahill D.P., Lengauer C., Yu J., Riggins G.J., Willson J.K., Markowitz S.D., Kinzler K.W., Vogelstein B. Mutations of mitotic checkpoint genes in human cancers. Nature. 1998;392:300–303. - PubMed
- Chen R.H., Waters J.C., Salmon E.D., Murray A.W. Association of spindle assembly checkpoint component XMAD2 with unattached kinetochores. Science. 1996;274:242–246. - PubMed
Publication types
MeSH terms
Substances
LinkOut - more resources
Full Text Sources
Other Literature Sources
Molecular Biology Databases


