Dynamic force spectroscopy of single DNA molecules - PubMed (original) (raw)
Dynamic force spectroscopy of single DNA molecules
T Strunz et al. Proc Natl Acad Sci U S A. 1999.
Abstract
To explore the analytic relevance of unbinding force measurements between complementary DNA strands with an atomic force microscope, we measured the forces to mechanically separate a single DNA duplex under physiological conditions by pulling at the opposite 5'-ends as a function of the loading rate (dynamic force spectroscopy). We investigated DNA duplexes with 10, 20, and 30 base pairs with loading rates in the range of 16-4,000 pN/s. Depending on the loading rate and sequence length, the unbinding forces of single duplexes varied from 20 to 50 pN. These unbinding forces are found to scale with the logarithm of the loading rate, which is interpreted in terms of a single energy barrier along the mechanical separation path. The parameters describing the energy landscape, i.e. , the distance of the energy barrier to the minimum energy along the separation path and the logarithm of the thermal dissociation rate, are found to be proportional to the number of base pairs of the DNA duplex. These single molecule results allow a quantitative comparison with data from thermodynamic ensemble measurements and a discussion of the analytic applications of unbinding force measurements for DNA.
Figures
Figure 1
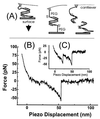
Measurement of unbinding forces. (A) The complementary single strands of a DNA are immobilized on an AFM tip and a surface via their 5′-ends by PEG linker molecules. On approach of the surface to the tip, a duplex may form that is loaded on retract until an unbinding occurs. (B) A typical force-versus-piezo displacement for the DNA duplex a⋅b during the retract of the sample with a velocity of 100 nm/s shows that, after initial contact of the tip with the surface (positive force values), the DNA duplex is loaded and the 30 nm long PEG-linker molecules are stretched (negative force values). At a displacement of ≈50 nm, the duplex unbinds at a loading of 50 pN. (C) A force displacement curve in which two molecules unbind one after the other, the last unbinding event also being at ≈50 pN loading.
Figure 2
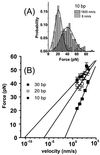
The probability distribution of the unbinding forces of the last rupture events for ≈500 approach/retract cycles for a retract velocity of 100 nm/s. (A) The histograms show the specific a-tip/b-surface interaction (gray) and the unspecific a-tip/a-surface interaction (black). (B) Histograms of the b-tip versus a- (gray) and b-surface (black) unbinding force distribution. This tip shows an increase in multiple unbinding forces and unspecific binding. The comparison of all four tip/surface combinations demonstrates the specificity of the unbinding force experiment. In both histograms, the most probable unbinding force is ≈50 pN. The maximum of the distribution is found by a Gaussian fit to be, for example, 48 ± 2 pN in A.
Figure 3
Velocity dependence of the unbinding forces. (A) The maximum of the unbinding force distribution for the a⋅d duplex (10 bp) is shifted from 21 to 41 pN (from Gaussian fits) when increasing the retract velocity from 8 to 1,600 nm/s. The broadening of the distribution is partially attributable to an increase of noise in the force displacement curves at higher retract velocities (because the rate of data acquisition is constant, fewer deflection values are acquired to determine the force at higher velocities). (B) The dependence of the most probable unbinding force on the retract velocity for an a-tip against a b-surface (30 bp), c-surface (20 bp), and d-surface (10 bp) and linear fits to the respective data sets. The extrapolation to zero unbinding force gives an estimate for the thermal off-rate.
Figure 4
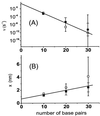
Measured parameters of the single energy barrier model (Eq. 1). The thermal off-rate ν (A) and the separation x (B) were determined from the linear fits of Fig. 3_B_ (filled squares) and an additional data set [obtained from b-tip/a-surface, a-tip/c-surface, and a-tip/d-surface measurements (open squares)]. Error bars are the statistical errors of the fits. The separation and the logarithm of the thermal off-rate scale linearly with the number of base pairs.
Figure 5
Geometrical considerations. (A) The mechanical unbinding path is suggested to be similar to the thermal dissociation path: Starting from a B-DNA helix, representing the energy minimum, thermal fluctuations will open the helix at the ends and drive the system over the reduced energy barrier _E_-Fx. Here, the transition state has one base pair and stretched single-stranded ends that would lead (as an upper limit) to a separation increase x of 3.6 Å per base pair. (B and C) A nick (B) (located far away form the helix ends) experiences a force that should be independent of the geometry of the force at the helix ends—i.e., if the force is applied via the 3′- or 5′-ends. Therefore, the melting on stretching of a DNA (B) corresponds to the unbinding of the DNA duplex on loading via both 5′-ends (C). (C and D) The difference in the unbinding geometry of the 5′-end to 3′-end (D) and the 5′-end to 5′-end (C) separation of a DNA duplex leads to different unbinding forces because the length gained on opening one base pair is ≈2× bigger in the first compared with the second case.
Similar articles
- Effects of contact force and salt concentration on the unbinding of a DNA duplex by force spectroscopy.
Vander Wal M, Kamper S, Headley J, Sinniah K. Vander Wal M, et al. Langmuir. 2006 Jan 31;22(3):882-6. doi: 10.1021/la0523560. Langmuir. 2006. PMID: 16430242 - B-S transition in short oligonucleotides.
Morfill J, Kühner F, Blank K, Lugmaier RA, Sedlmair J, Gaub HE. Morfill J, et al. Biophys J. 2007 Oct 1;93(7):2400-9. doi: 10.1529/biophysj.107.106112. Epub 2007 Jun 8. Biophys J. 2007. PMID: 17557787 Free PMC article. - Stretching and breaking duplex DNA by chemical force microscopy.
Noy A, Vezenov DV, Kayyem JF, Meade TJ, Lieber CM. Noy A, et al. Chem Biol. 1997 Jul;4(7):519-27. doi: 10.1016/s1074-5521(97)90324-0. Chem Biol. 1997. PMID: 9263640 - Atomic force microscopy: determination of unbinding force, off rate and energy barrier for protein-ligand interaction.
Lee CK, Wang YM, Huang LS, Lin S. Lee CK, et al. Micron. 2007;38(5):446-61. doi: 10.1016/j.micron.2006.06.014. Epub 2006 Jul 28. Micron. 2007. PMID: 17015017 Review. - Practical single molecule force spectroscopy: how to determine fundamental thermodynamic parameters of intermolecular bonds with an atomic force microscope.
Noy A, Friddle RW. Noy A, et al. Methods. 2013 Apr 1;60(2):142-50. doi: 10.1016/j.ymeth.2013.03.014. Epub 2013 Mar 24. Methods. 2013. PMID: 23531626 Review.
Cited by
- Structure and energy of a DNA dodecamer under tensile load.
Piana S. Piana S. Nucleic Acids Res. 2005 Dec 14;33(22):7029-38. doi: 10.1093/nar/gki1010. Print 2005. Nucleic Acids Res. 2005. PMID: 16356925 Free PMC article. - Improving single molecule force spectroscopy through automated real-time data collection and quantification of experimental conditions.
Scholl ZN, Marszalek PE. Scholl ZN, et al. Ultramicroscopy. 2014 Jan;136:7-14. doi: 10.1016/j.ultramic.2013.07.020. Epub 2013 Aug 7. Ultramicroscopy. 2014. PMID: 24001740 Free PMC article. - DNA-coated microbubbles with biochemically tunable ultrasound contrast activity.
Nakatsuka MA, Hsu MJ, Esener SC, Cha JN, Goodwin AP. Nakatsuka MA, et al. Adv Mater. 2011 Nov 9;23(42):4908-12. doi: 10.1002/adma.201102677. Epub 2011 Sep 28. Adv Mater. 2011. PMID: 21956383 Free PMC article. - Locked nucleic acid oligomers as handles for single molecule manipulation.
Berezney JP, Saleh OA. Berezney JP, et al. Nucleic Acids Res. 2014 Oct 29;42(19):e150. doi: 10.1093/nar/gku760. Epub 2014 Aug 26. Nucleic Acids Res. 2014. PMID: 25159617 Free PMC article. - DNA nanoswitches: a quantitative platform for gel-based biomolecular interaction analysis.
Koussa MA, Halvorsen K, Ward A, Wong WP. Koussa MA, et al. Nat Methods. 2015 Feb;12(2):123-126. doi: 10.1038/nmeth.3209. Epub 2014 Dec 8. Nat Methods. 2015. PMID: 25486062 Free PMC article.
References
- Lee G U, Kidwell D A, Colton R J. Langmuir. 1994;10:354–357.
- Florin E L, Moy V T, Gaub H. Science. 1994;264:415–417. - PubMed
- Dammer U, Popescu O, Wagner P, Anselmetti D, Güntherodt H-J, Misevic G N. Science. 1995;267:1173–1175. - PubMed
- Lee G U, Chrisley L A, Colton R J. Science. 1994;266:771–773. - PubMed
Publication types
MeSH terms
Substances
LinkOut - more resources
Full Text Sources
Other Literature Sources


