Slow transport of unpolymerized tubulin and polymerized neurofilament in the squid giant axon - PubMed (original) (raw)
Slow transport of unpolymerized tubulin and polymerized neurofilament in the squid giant axon
J A Galbraith et al. Proc Natl Acad Sci U S A. 1999.
Abstract
A major issue in the slow transport of cytoskeletal proteins is the form in which they are transported. We have investigated the possibility that unpolymerized as well as polymerized cytoskeletal proteins can be actively transported in axons. We report the active transport of highly diffusible tubulin oligomers, as well as transport of the less diffusible neurofilament polymers. After injection into the squid giant axon, tubulin was transported in an anterograde direction at an average rate of 2.3 mm/day, whereas neurofilament was moved at 1.1 mm/day. Addition of the metabolic poisons cyanide or dinitrophenol reduced the active transport of both proteins to less than 10% of control values, whereas disruption of microtubules by treatment of the axon with cold in the presence of nocodazole reduced transport of both proteins to approximately 20% of control levels. Passive diffusion of these proteins occurred in parallel with transport. The diffusion coefficient of the moving tubulin in axoplasm was 8.6 micrometer(2)/s compared with only 0.43 micrometer(2)/s for neurofilament. These results suggest that the tubulin was transported in the unpolymerized state and that the neurofilament was transported in the polymerized state by an energy-dependent nocodazole/cold-sensitive transport mechanism.
Figures
Figure 1
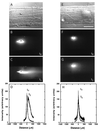
Active transport and diffusion of fluorescently labeled neurofilament proteins in normal (A–D) and metabolically poisoned (E–H) squid giant axons. The metabolically poisoned axons show a small amount of spreading but no anterograde movement of the neurofilament. (A and E) Bright-field image showing the oil drop injected into the axon. (B and F) Fluorescent image of the neurofilament protein distribution soon after injection (_t_0). The oil drop is visible as a dark circle surrounded by bright neurofilament fluorescence. (C and G) Fluorescence distribution 3 hr later (_t_1), showing the anterograde (to the right) movement of the neurofilament protein in C. (D and H) Intensity trace of the neurofilament fluorescence. The axis is centered on the oil drop. (The scale bar in E is 250 μm for all images.)
Figure 2
Active transport and diffusion of fluorescently labeled tubulin proteins. Note that tubulin diffused much more extensively than the neurofilament shown in Fig. 1. The images are arranged as in Fig. 1: A and E, bright-field; B and F, fluorescent image soon after injection; C and G, 3 hr later; and D and H, trace of fluorescence intensity. (The scale bar in E is 250 μm for all images; length scales of the intensity traces are the same as Fig. 1.)
Similar articles
- Tubulin and neurofilament proteins are transported differently in axons of chicken motoneurons.
Yuan A, Mills RG, Chia CP, Bray JJ. Yuan A, et al. Cell Mol Neurobiol. 2000 Dec;20(6):623-32. doi: 10.1023/a:1007090422866. Cell Mol Neurobiol. 2000. PMID: 11100972 Free PMC article. - Visualization of slow axonal transport in vivo.
Terada S, Nakata T, Peterson AC, Hirokawa N. Terada S, et al. Science. 1996 Aug 9;273(5276):784-8. doi: 10.1126/science.273.5276.784. Science. 1996. PMID: 8670416 - Transport complexes associated with slow axonal flow.
Bray JJ, Mills RG. Bray JJ, et al. Neurochem Res. 1991 Jun;16(6):645-9. doi: 10.1007/BF00965550. Neurochem Res. 1991. PMID: 1724292 Review. - Stable polymers of the axonal cytoskeleton: the axoplasmic ghost.
Morris JR, Lasek RJ. Morris JR, et al. J Cell Biol. 1982 Jan;92(1):192-8. doi: 10.1083/jcb.92.1.192. J Cell Biol. 1982. PMID: 7199050 Free PMC article. - Slow axonal transport: fast motors in the slow lane.
Shah JV, Cleveland DW. Shah JV, et al. Curr Opin Cell Biol. 2002 Feb;14(1):58-62. doi: 10.1016/s0955-0674(01)00294-0. Curr Opin Cell Biol. 2002. PMID: 11792545 Review.
Cited by
- Rapid intermittent movement of axonal neurofilaments observed by fluorescence photobleaching.
Wang L, Brown A. Wang L, et al. Mol Biol Cell. 2001 Oct;12(10):3257-67. doi: 10.1091/mbc.12.10.3257. Mol Biol Cell. 2001. PMID: 11598207 Free PMC article. - Quantitative measurements and modeling of cargo-motor interactions during fast transport in the living axon.
Seamster PE, Loewenberg M, Pascal J, Chauviere A, Gonzales A, Cristini V, Bearer EL. Seamster PE, et al. Phys Biol. 2012 Oct;9(5):055005. doi: 10.1088/1478-3975/9/5/055005. Epub 2012 Sep 25. Phys Biol. 2012. PMID: 23011729 Free PMC article. - DISC1 regulates neurotrophin-induced axon elongation via interaction with Grb2.
Shinoda T, Taya S, Tsuboi D, Hikita T, Matsuzawa R, Kuroda S, Iwamatsu A, Kaibuchi K. Shinoda T, et al. J Neurosci. 2007 Jan 3;27(1):4-14. doi: 10.1523/JNEUROSCI.3825-06.2007. J Neurosci. 2007. PMID: 17202467 Free PMC article. - Neurofilaments consist of distinct populations that can be distinguished by C-terminal phosphorylation, bundling, and axonal transport rate in growing axonal neurites.
Yabe JT, Chylinski T, Wang FS, Pimenta A, Kattar SD, Linsley MD, Chan WK, Shea TB. Yabe JT, et al. J Neurosci. 2001 Apr 1;21(7):2195-205. doi: 10.1523/JNEUROSCI.21-07-02195.2001. J Neurosci. 2001. PMID: 11264295 Free PMC article. - Microtubule retrograde flow retains neuronal polarization in a fluctuating state.
Schelski M, Bradke F. Schelski M, et al. Sci Adv. 2022 Nov 4;8(44):eabo2336. doi: 10.1126/sciadv.abo2336. Epub 2022 Nov 4. Sci Adv. 2022. PMID: 36332023 Free PMC article.
References
- Sabry J, O’Connor T P, Kirschner M W. Neuron. 1995;14:1247–1256. - PubMed
- Grafstein B, Forman D S. Physiol Rev. 1980;60:1167–1283. - PubMed
- Nixon R A. Curr Opin Cell Biol. 1998;10:87–92. - PubMed
- Lasek R J. J Cell Sci Suppl. 1986;5:161–179. - PubMed
MeSH terms
Substances
LinkOut - more resources
Full Text Sources

