Functional genomics: expression analysis of Escherichia coli growing on minimal and rich media - PubMed (original) (raw)
Comparative Study
Functional genomics: expression analysis of Escherichia coli growing on minimal and rich media
H Tao et al. J Bacteriol. 1999 Oct.
Abstract
DNA arrays of the entire set of Escherichia coli genes were used to measure the genomic expression patterns of cells growing in late logarithmic phase on minimal glucose medium and on Luria broth containing glucose. Ratios of the transcript levels for all 4,290 E. coli protein-encoding genes (cds) were obtained, and analysis of the expression ratio data indicated that the physiological state of the cells under the two growth conditions could be ascertained. The cells in the rich medium grew faster, and expression of the majority of the translation apparatus genes was significantly elevated under this growth condition, consistent with known patterns of growth rate-dependent regulation and increased rate of protein synthesis in rapidly growing cells. The cells grown on minimal medium showed significantly elevated expression of many genes involved in biosynthesis of building blocks, most notably the amino acid biosynthetic pathways. Nearly half of the known RpoS-dependent genes were expressed at significantly higher levels in minimal medium than in rich medium, and rpoS expression was similarly elevated. The role of RpoS regulation in these logarithmic phase cells was suggested by the functions of the RpoS dependent genes that were induced. The hallmark features of E. coli cells growing on glucose minimal medium appeared to be the formation and excretion of acetate, metabolism of the acetate, and protection of the cells from acid stress. A hypothesis invoking RpoS and UspA (universal stress protein, also significantly elevated in minimal glucose medium) as playing a role in coordinating these various aspects and consequences of glucose and acetate metabolism was generated. This experiment demonstrates that genomic expression assays can be applied in a meaningful way to the study of whole-bacterial-cell physiology for the generation of hypotheses and as a guide for more detailed studies of particular genes of interest.
Figures
FIG. 1
Growth of E. coli MG1655 on Luria broth plus glucose (open squares), minimal glucose medium (open circles), and minimal gluconate medium (solid circles). Cells were harvested for genomic expression analysis at an absorbance at 600 nm (_A_600) of 0.6.
FIG. 2
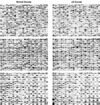
DNA arrays of the entire set of E. coli genes hybridized with probes generated from RNA extracted from cells growing in late logarithmic phase on minimal glucose medium (left) and on Luria broth (LB) containing glucose (right).
FIG. 3
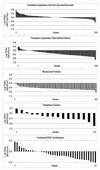
The log expression ratios of all E. coli genes were plotted for minimal glucose versus Luria broth plus glucose (top) and for minimal glucose versus minimal gluconate (bottom). The entire data sets were sorted in Excel spreadsheets by the log expression ratio values, and a bar chart was generated by the software, with individual genes plotted on the x axis and the log expression ratios plotted on the y axis. Genes more highly expressed under the first condition are positive, and genes more highly expressed under the second condition are negative. The horizontal divisions (dashed lines) represent 99% confidence levels, such that any gene with a value extending beyond the first horizontal division in either direction is significantly expressed at a higher level under that condition.
FIG. 4
Log expression ratios of the translation apparatus genes sorted by value. The set of all translation apparatus genes is shown in the top two panels for the minimal glucose versus minimal gluconate and minimal glucose versus Luria broth plus glucose experiments (see the legend to Fig. 3). The bottom three panels show the results of the minimal glucose versus Luria broth plus glucose experiment for functionally grouped subsets of the translation apparatus genes.
FIG. 5
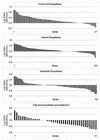
Log expression ratios of biosynthetic genes were sorted by value for the minimal glucose versus Luria broth plus glucose experiment and are grouped by related pathways.
FIG. 6
Log expression ratios of cell process genes and regulatory genes sorted by value for the minimal glucose versus Luria broth plus glucose experiment.
Similar articles
- Control of RpoS in global gene expression of Escherichia coli in minimal media.
Dong T, Schellhorn HE. Dong T, et al. Mol Genet Genomics. 2009 Jan;281(1):19-33. doi: 10.1007/s00438-008-0389-3. Epub 2008 Oct 9. Mol Genet Genomics. 2009. PMID: 18843507 - Control of acid resistance in Escherichia coli.
Castanie-Cornet MP, Penfound TA, Smith D, Elliott JF, Foster JW. Castanie-Cornet MP, et al. J Bacteriol. 1999 Jun;181(11):3525-35. doi: 10.1128/JB.181.11.3525-3535.1999. J Bacteriol. 1999. PMID: 10348866 Free PMC article. - Back to log phase: sigma S as a global regulator in the osmotic control of gene expression in Escherichia coli.
Hengge-Aronis R. Hengge-Aronis R. Mol Microbiol. 1996 Sep;21(5):887-93. doi: 10.1046/j.1365-2958.1996.511405.x. Mol Microbiol. 1996. PMID: 8885260 Review. - Gene expression analysis of the response by Escherichia coli to seawater.
Rozen Y, Larossa RA, Templeton LJ, Smulski DR, Belkin S. Rozen Y, et al. Antonie Van Leeuwenhoek. 2002 Aug;81(1-4):15-25. doi: 10.1023/a:1020500821856. Antonie Van Leeuwenhoek. 2002. PMID: 12448701 Review.
Cited by
- Past, Present, and Future of Genome Modification in Escherichia coli.
Mori H, Kataoka M, Yang X. Mori H, et al. Microorganisms. 2022 Sep 14;10(9):1835. doi: 10.3390/microorganisms10091835. Microorganisms. 2022. PMID: 36144436 Free PMC article. Review. - DNA microarray-mediated transcriptional profiling of the Escherichia coli response to hydrogen peroxide.
Zheng M, Wang X, Templeton LJ, Smulski DR, LaRossa RA, Storz G. Zheng M, et al. J Bacteriol. 2001 Aug;183(15):4562-70. doi: 10.1128/JB.183.15.4562-4570.2001. J Bacteriol. 2001. PMID: 11443091 Free PMC article. - Predicted highly expressed genes of diverse prokaryotic genomes.
Karlin S, Mrázek J. Karlin S, et al. J Bacteriol. 2000 Sep;182(18):5238-50. doi: 10.1128/JB.182.18.5238-5250.2000. J Bacteriol. 2000. PMID: 10960111 Free PMC article. - Transcriptional response of Pasteurella multocida to nutrient limitation.
Paustian ML, May BJ, Kapur V. Paustian ML, et al. J Bacteriol. 2002 Jul;184(13):3734-9. doi: 10.1128/JB.184.13.3734-3739.2002. J Bacteriol. 2002. PMID: 12057970 Free PMC article. - Regulatory interactions of Csr components: the RNA binding protein CsrA activates csrB transcription in Escherichia coli.
Gudapaty S, Suzuki K, Wang X, Babitzke P, Romeo T. Gudapaty S, et al. J Bacteriol. 2001 Oct;183(20):6017-27. doi: 10.1128/JB.183.20.6017-6027.2001. J Bacteriol. 2001. PMID: 11567002 Free PMC article.
References
- Amarasingham C R, Davis B D. Regulation of α-ketoglutarate dehydrogenase formation in Escherichia coli. J Biol Chem. 1965;240:3664–3668. - PubMed
- Aoki H, Dekany K, Adams S L, Ganoza M C. The gene encoding the elongation factor P protein is essential for viability and is required for protein synthesis. J Biol Chem. 1997;272:32254–32259. - PubMed
- Bender R A. Variations on a theme by Escherichia. In: Neidhardt F C, Curtiss III R, Ingraham J L, Lin E C C, Low K B, Magasanik B, Reznikoff W S, Riley M, Schaechter M, Umbarger H E, editors. Escherichia coli and Salmonella: cellular and molecular biology. 2nd ed. Washington, D.C.: ASM Press; 1996. pp. 4–9.
Publication types
MeSH terms
Substances
LinkOut - more resources
Full Text Sources
Other Literature Sources


