Optical recording of signal-mediated protein transport through single nuclear pore complexes - PubMed (original) (raw)
Optical recording of signal-mediated protein transport through single nuclear pore complexes
O Keminer et al. Proc Natl Acad Sci U S A. 1999.
Abstract
Optical single-transporter recording, a recently established fluorescence microscopic method, was used to study the selective transport of proteins through single nuclear pore complexes (NPCs) of Xenopus oocytes. Recombinant proteins containing either a nuclear localization signal (import protein) or a nuclear export signal (export protein) were generated as transport substrates. To approximate in vivo conditions as closely as possible, a Xenopus egg extract was applied to the cytosolic side and a Xenopus oocyte nuclear extract to the nuclear side of the NPCs. It was found that protein transport through functionally isolated, "patched" NPCs depended on signal sequences, extracts, and metabolic energy, as in vivo. All NPCs were competent for both import and export. The transport direction was strictly determined by the transport signal, and at none of the conditions explored was the import protein exported or the export protein imported, even when the application sides of the extracts were reversed. The mean transport rates of the single NPC were approximately 2 dimers/s for the import protein and approximately 4 dimers/s for the export protein ( approximately 15 microM substrate concentration, 22-24 degrees C), in good agreement with in vivo rates estimated for mammalian cells by microinjection experiments. The study shows that optical single-transporter recording permits the analysis of membrane transport processes not previously accessible to single-transporter recording and thus provides additional possibilities for the elucidation of nucleocytoplasmic transport mechanisms.
Figures
Figure 1
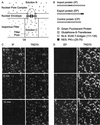
Optical recording of signal-mediated protein transport through single NPCs. (A) The principle. The nuclear envelope of Xenopus oocytes is firmly attached to isoporous filters. Filter pores are sealed by mineral oil. Transport into or out of individual filter pores is measured by confocal laser scanning microscopy. (B) The transport substrates. The recombinant green fluorescent proteins IP, EP, and CP contained either a nuclear localization signal (NLS), nuclear export signal (NES), or no localization signal. (C) Import of IP. Filter pores were filled with a solution containing IP (green fluorescence), TRD70 (red fluorescence), and egg extract while a nuclear extract was applied to the unclear side. Upon addition of ATP (0 min) IP was transported out of the filter pores via the NPCs. Simultaneously, the constant TRD70 fluorescence indicated the tightness of sealing and the integrity of the NPCs. (D) Export no EP. EP was added to nuclear side and IP was omitted on the cytoplasmic side, otherwise analogous to C.
Figure 2
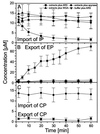
Import of IP and export of EP depend on signal sequences, extracts providing soluble transport cofactors, and metabolic energy, and can be inhibited by WGA. (A) From confocal scans as shown in Fig. 1_C_ the time-dependent fluorescence of many filter pores was derived and averaged. Omission of extracts, addition of the ATPase apyrase, or the lectin WGA inhibits transport. (B) Analogous experiments pertaining to the export of EP. (C) CP, containing no localization signal, is neither imported nor exported.
Figure 3
Directionality of transport. The application of the recombinant green fluorescent proteins IP and EP and of egg and nuclear extract to the cytoplasmic and nuclear side of the NPC was permutated to obtain clues for the parameters determining the directionality of transport. See text for details.
Figure 4
Protein transport rate of the NPC. (A and B) From confocal scans as shown in Fig. 1 C and D the time-dependent fluorescence of single-filter pores was derived. Fluorescence was converted into concentration and fitted by a simple exponential. The fit was used to derive the initial rate and, taking the volume of the filter pore into account, expressed in molecules/s per patch. (C_–_F) Populations of transport rates were plotted as frequency diagrams where C and D are the raw data, and E and F are smoothed data. The peaks that are equidistantly spaced on the abscissa represent membrane patches with one, two, or three NPCs.
Similar articles
- Use of Xenopus laevis oocyte nuclei and nuclear envelopes in nucleocytoplasmic transport studies.
Peters R. Peters R. Methods Mol Biol. 2006;322:259-72. doi: 10.1007/978-1-59745-000-3_18. Methods Mol Biol. 2006. PMID: 16739729 Review. - Nuclear transport kinetics in microarrays of nuclear envelope patches.
Peters R, Coutavas E, Siebrasse JP. Peters R, et al. J Struct Biol. 2002 Oct-Dec;140(1-3):268-78. doi: 10.1016/s1047-8477(02)00525-7. J Struct Biol. 2002. PMID: 12490174 Review. - Distinct functions for the two importin subunits in nuclear protein import.
Görlich D, Vogel F, Mills AD, Hartmann E, Laskey RA. Görlich D, et al. Nature. 1995 Sep 21;377(6546):246-8. doi: 10.1038/377246a0. Nature. 1995. PMID: 7675110 - In vitro nuclear import of snRNPs: cytosolic factors mediate m3G-cap dependence of U1 and U2 snRNP transport.
Marshallsay C, Lührmann R. Marshallsay C, et al. EMBO J. 1994 Jan 1;13(1):222-31. doi: 10.1002/j.1460-2075.1994.tb06252.x. EMBO J. 1994. PMID: 8306964 Free PMC article. - Visualizing Nuclear Pore Complexes in Xenopus Egg Extracts.
Mishra S, Levy DL. Mishra S, et al. Methods Mol Biol. 2022;2502:395-405. doi: 10.1007/978-1-0716-2337-4_25. Methods Mol Biol. 2022. PMID: 35412252 Free PMC article.
Cited by
- Reversibility in nucleocytoplasmic transport.
Kopito RB, Elbaum M. Kopito RB, et al. Proc Natl Acad Sci U S A. 2007 Jul 31;104(31):12743-8. doi: 10.1073/pnas.0702690104. Epub 2007 Jul 23. Proc Natl Acad Sci U S A. 2007. PMID: 17646647 Free PMC article. - Kinetics of protein import into isolated Xenopus oocyte nuclei.
Radtke T, Schmalz D, Coutavas E, Soliman TM, Peters R. Radtke T, et al. Proc Natl Acad Sci U S A. 2001 Feb 27;98(5):2407-12. doi: 10.1073/pnas.051616598. Epub 2001 Feb 20. Proc Natl Acad Sci U S A. 2001. PMID: 11226252 Free PMC article. - Nanoscale mechanism of molecular transport through the nuclear pore complex as studied by scanning electrochemical microscopy.
Kim J, Izadyar A, Nioradze N, Amemiya S. Kim J, et al. J Am Chem Soc. 2013 Feb 13;135(6):2321-9. doi: 10.1021/ja311080j. Epub 2013 Jan 30. J Am Chem Soc. 2013. PMID: 23320434 Free PMC article. - Multiscale dynamics in nucleocytoplasmic transport.
Grünwald D, Singer RH. Grünwald D, et al. Curr Opin Cell Biol. 2012 Feb;24(1):100-6. doi: 10.1016/j.ceb.2011.11.011. Epub 2011 Dec 22. Curr Opin Cell Biol. 2012. PMID: 22196930 Free PMC article. Review. - The yeast nuclear pore complex: composition, architecture, and transport mechanism.
Rout MP, Aitchison JD, Suprapto A, Hjertaas K, Zhao Y, Chait BT. Rout MP, et al. J Cell Biol. 2000 Feb 21;148(4):635-51. doi: 10.1083/jcb.148.4.635. J Cell Biol. 2000. PMID: 10684247 Free PMC article.
References
- Neher E, Sakman B. Nature (London) 1976;260:770–802.
- Sakmann B, Neher E. Single-Channel Recording. 2nd Ed. New York: Plenum; 1995.
- Peters R, Peters J, Tews K H, Bähr W. Biochim Biophys Acta. 1974;367:282–294. - PubMed
- Wedekind P, Kubitscheck U, Peters R. J Microsc. 1994;176:23–33. - PubMed
- Tschödrich-Rotter M, Peters R. J Microsc. 1998;192:114–125. - PubMed
Publication types
MeSH terms
Substances
LinkOut - more resources
Full Text Sources


