Human G protein-coupled receptor GPR-9-6/CC chemokine receptor 9 is selectively expressed on intestinal homing T lymphocytes, mucosal lymphocytes, and thymocytes and is required for thymus-expressed chemokine-mediated chemotaxis - PubMed (original) (raw)
. 1999 Nov 1;190(9):1241-56.
doi: 10.1084/jem.190.9.1241.
W W Agace, J J Campbell, H M Heath, D Parent, A I Roberts, E C Ebert, N Kassam, S Qin, M Zovko, G J LaRosa, L L Yang, D Soler, E C Butcher, P D Ponath, C M Parker, D P Andrew
Affiliations
- PMID: 10544196
- PMCID: PMC2195678
- DOI: 10.1084/jem.190.9.1241
Human G protein-coupled receptor GPR-9-6/CC chemokine receptor 9 is selectively expressed on intestinal homing T lymphocytes, mucosal lymphocytes, and thymocytes and is required for thymus-expressed chemokine-mediated chemotaxis
B A Zabel et al. J Exp Med. 1999.
Abstract
TECK (thymus-expressed chemokine), a recently described CC chemokine expressed in thymus and small intestine, was found to mediate chemotaxis of human G protein-coupled receptor GPR-9-6/L1.2 transfectants. This activity was blocked by anti-GPR-9-6 monoclonal antibody (mAb) 3C3. GPR-9-6 is expressed on a subset of memory alpha4beta7(high) intestinal trafficking CD4 and CD8 lymphocytes. In addition, all intestinal lamina propria and intraepithelial lymphocytes express GPR-9-6. In contrast, GPR-9-6 is not displayed on cutaneous lymphocyte antigen-positive (CLA(+)) memory CD4 and CD8 lymphocytes, which traffic to skin inflammatory sites, or on other systemic alpha4beta7(-)CLA(-) memory CD4/CD8 lymphocytes. The majority of thymocytes also express GPR-9-6, but natural killer cells, monocytes, eosinophils, basophils, and neutrophils are GPR-9-6 negative. Transcripts of GPR-9-6 and TECK are present in both small intestine and thymus. Importantly, the expression profile of GPR-9-6 correlates with migration to TECK of blood T lymphocytes and thymocytes. As migration of these cells is blocked by anti-GPR-9-6 mAb 3C3, we conclude that GPR-9-6 is the principal chemokine receptor for TECK. In agreement with the nomenclature rules for chemokine receptors, we propose the designation CCR-9 for GPR-9-6. The selective expression of TECK and GPR-9-6 in thymus and small intestine implies a dual role for GPR-9-6/CCR-9, both in T cell development and the mucosal immune response.
Figures
Figure 1
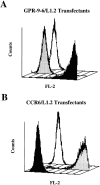
The mAb 3C3 binds to GPR-9-6 transfectants. (A) GPR-9-6/L1.2 transfectants were stained with mAb 3C3 (black profile), an IgG2b control mAb (white), and an anti-CCR6 mAb (gray). (B) CCR6/L1.2 transfectants were stained with the same anti-CCR6 (gray), 3C3 (black), and IgG2b (white) mAbs (n = 2).
Figure 2
GPR-9-6 is expressed on subsets of CD4 and CD8 lymphocytes as well as on most thymocytes. The mAb 3C3 was used in two-color studies on mononuclear cells along with a F(ab)2 anti–mouse IgG–PE second stage and anti-CD4–FITC, anti-CD8–FITC, anti-CD19–FITC, anti-CCR3–FITC, and anti-CD56–Cychrome mAbs. For thymocytes, two-color studies were performed with 3C3 and anti-TCR–Cychrome. The percentage of cells falling within each quadrant is shown at the upper right. Staining with an isotype control IgG2b mAb followed by F(ab)2 anti–mouse IgG–PE was performed and gave FL2 values <10 U (n = 6).
Figure 3
GPR-9-6 is expressed on β7highCLA− memory CD4 lymphocytes. Mononuclear cells were stained in three-color experiments using anti-CD4–Tricolor to gate on CD4 lymphocytes. The cells were also stained with anti–GPR-9-6 mAb 3C3 followed by F(ab)2 anti–mouse IgG–PE or –FITC to study GPR-9-6 expression on subsets defined with dye-linked mAbs: anti-αE–FITC (HML1), anti-β7–PE (Fib504), anti-CD49d–PE (HP2/1), anti-CLA–FITC (HECA 452), anti-CD45RO–FITC (UCLH1), and anti-CD62L–PE (Dreg 56). Staining with an isotype control IgG2b mAb followed by F(ab)2 anti–mouse IgG–PE/FITC was performed and gave FL1/FL2 values <10 U. The percentage of cells falling within each quadrant is shown in the upper right (n = 5).
Figure 4
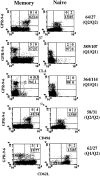
Characterization of GPR-9-6 expression on memory and naive CD4 lymphocytes: Mononuclear cells were stained in four-color experiments using anti-CD4–TC and anti-CD45RO–allophycocyanin to gate on memory and naive CD4 lymphocytes. The cells were also stained with anti–GPR-9-6 mAb 3C3 followed by F(ab)2 anti–mouse IgG–PE or –FITC to study GPR-9-6 expression on subsets defined with dye-linked mAbs: anti-αE–FITC (HML1), anti-β7–PE (Fib504), anti-CD49d–PE (HP2/1), anti-CLA–FITC (HECA 452), and anti-CD62L–PE (Dreg 56). Staining with an isotype control IgG2b mAb followed by F(ab)2 anti–mouse IgG–PE/FITC was performed and gave FL1/FL2 values <10 U. The percentage of cells falling within each quadrant is shown in the upper right. To directly compare the levels of GPR-9-6 on naive and memory subsets defined by expression of GPR-9-6, we show the ratio of the mean fluorescence intensity for memory/naive subset for the relevant quadrants (Q) (n = 3).
Figure 5
GPR-9-6 is expressed on β7high CLA− memory CD8 lymphocytes and predominantly αE+ CD8 lymphocytes. Mononuclear cells were stained in three-color experiments using anti-CD8–TC to gate CD8 lymphocytes. The cells were also stained with anti–GPR-9-6 mAb 3C3 followed by F(ab)2 anti–mouse IgG–PE or –FITC to study GPR-9-6 expression on subsets defined with dye-linked mAbs: anti-αE–FITC (HML1), anti-β7–PE (Fib504), anti-CD49d–PE (HP2/1), anti-CLA–FITC (HECA 452), anti-CD45RA–FITC, and anti-CD62L–PE (Dreg 56). Staining with an isotype control IgG2b mAb followed by F(ab)2 anti–mouse IgG–PE/FITC was performed and gave values <10 U. The percentage of cells falling within each quadrant is shown in the upper right (n = 4).
Figure 7
Modulation of GPR-9-6 on lymphocytes by cytokines and upon T lymphocyte activation. (A and B) Chronically activated Th1 (dark line) and Th2 lymphocytes (thin line) at second stage activation were stained with anti-CXCR3 and anti–GPR-9-6 mAb 3C3. Staining of Th1 lymphocytes with an isotype control IgG2b mAb served as a negative control (dashed line). (C and D) Mononuclear cells were activated with plate-bound anti-TCR mAb OKT3 for 4 d followed by expansion with IL-2 at 5 ng/ml. Aliquots of cells were stained at the indicated times with anti–GPR-9-6, anti-CCR5, and anti-CCR6 to determine the effect of T lymphocyte activation upon expression of GPR-9-6 (C) and other chemokine receptors (D), using an anti-CD3 mAb to directly label the T lymphocytes (n = 2).
Figure 6
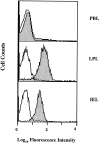
GPR-9-6 is expressed on intestinal IELs and LPLs. Freshly isolated LPLs and IELs were stained with anti–GPR-9-6 mAb 3C3 (gray profile) or with a mouse IgG2b control mAb (white). PBLs were also stained as an internal control from a separate donor. Similar results were obtained from four different mucosal cell populations.
Figure 8
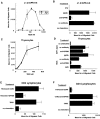
GPR-9-6 is a chemokine receptor for TECK. (A) GPR-9-6 transfectants were examined for chemotactic responses to various concentrations of TECK and I-TAC ranging from 10 to 1,000 nM. (B) The effect of anti–GPR-9-6 mAb 3C3 and pertussis toxin (PTX) on the migration was examined. All mAb treatments were for 10 min at 4°C before the migration assay. (C) Thymocytes were examined for their chemotaxis to various concentrations of TECK. (D) The effect of anti–GPR-9-6 mAb 3C3 and an IgG2b control on TECK- and SDF-1α–induced thymocyte migration was also examined. The effect of anti–GPR-9-6 mAb and anti-CCR4 mAb 2B10 on the chemotaxis of CD4 lymphocytes to TECK (E) and TARC (F) was also tested (n = 2).
Figure 9
TECK preferentially attracts gut-homing memory CD4 lymphocytes and αE+α4β7+CD45RAlow/− CD8 lymphocytes. Mononuclear cells from two donors were allowed to migrate to 1 μM TECK (black bars) and also to medium (white). (A) The starting and migrated populations were analyzed by multiparameter flow cytometry to determine the percentages of skin-homing CLA+α4β7−, gut-homing memory CLA−α4β7+, and other systemic CLA−α4β7− memory CD4 lymphocytes in the starting and migrated populations. (B) The starting and migrated populations were analyzed to determine the percentage of αE+α4β7+, αE−α4β7+, and αE−α4β7−CD45RAlow/− CD8 lymphocytes in the starting and migrated populations. With knowledge of the total input and the number of migrated cells, these values are expressed as percentage of input (n = 3).
Figure 10
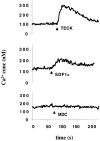
TECK induces Ca2+ flux in GPR-9-6+ Molt-4 cells. The GPR-9-6–expressing cell line Molt-4 was loaded with Ca2+ dye Fura-2 and then tested for the ability to mobilize Ca2+ in response to 150 nM TECK, 100 nM SDF-1α, and 100 nM MDC (n = 2).
Figure 11
Biotinylated TECK binds to Molt-4 cells. (A) Molt-4 and CEM cells were tested for their ability to bind to biotinylated TECK used at concentrations of 100, 50, 25, 12.5, 6.25, and 3.125 nM. (B) We also examined the effect of preincubating the cells for 10 min with 500 nM TECK, 500 nM MCP-1, and 50 ug/ml anti–GPR-9-6 mAb 3C3 or an IgG2b mAb on the binding of Molt-4 and CEM cells with biotinylated TECK (n = 2).
Figure 12
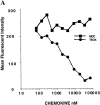
TECK blocks the binding of mAb 3C3 to GPR-9-6 on transfectants and lymphocytes. (A) L1.2/GPR-9-6 transfectants were preincubated with various concentrations of TECK or MDC on ice in PBS with 5% FCS, 10% human serum, and 0.2% azide for 10 min before the addition of mAb 3C3. (B) Mononuclear cells were treated in a similar manner but with either 500 nM MDC or 500 nM TECK. Cells were then stained as described in Materials and Methods (n = 2).
Figure 13
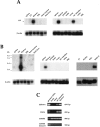
Tissue distribution of TECK and GPR-9-6. (A) TECK hybridizations: 32P-labeled TECK DNA was used to probe multitissue Northern blot filters (2 μg poly-A RNA per lane, 24-h exposure; Clontech). (B) GPR-9-6 hybridizations: 32P-labeled GPR-9-6 DNA was used to probe the same filters as in A as well as a multi-cell line Northern blot filter (72-h exposure). (C) Equivalent amounts (0.5 ng) of primary cDNA (Clontech) from colon, small intestine, brain, and thymus, as well as 500 ng genomic DNA were amplified in PCR (30 cycles) using GPR-9-6 and TECK primers. G3PDH primers and G3PDH intron B primers were used as controls.
Similar articles
- The role of thymus-expressed chemokine and its receptor CCR9 on lymphocytes in the regional specialization of the mucosal immune system.
Papadakis KA, Prehn J, Nelson V, Cheng L, Binder SW, Ponath PD, Andrew DP, Targan SR. Papadakis KA, et al. J Immunol. 2000 Nov 1;165(9):5069-76. doi: 10.4049/jimmunol.165.9.5069. J Immunol. 2000. PMID: 11046037 - Characterization of CCR9 expression and thymus-expressed chemokine responsiveness of the murine thymus, spleen and mesenteric lymph node.
Lee HS, Kim HR, Lee EH, Jang MH, Kim SB, Park JW, Seoh JY, Jung YJ. Lee HS, et al. Immunobiology. 2012 Apr;217(4):402-11. doi: 10.1016/j.imbio.2011.10.014. Epub 2011 Nov 3. Immunobiology. 2012. PMID: 22196895 - Expression of CCR9 beta-chemokine receptor is modulated in thymocyte differentiation and is selectively maintained in CD8(+) T cells from secondary lymphoid organs.
Carramolino L, Zaballos A, Kremer L, Villares R, Martín P, Ardavín C, Martínez-A C, Márquez G. Carramolino L, et al. Blood. 2001 Feb 15;97(4):850-7. doi: 10.1182/blood.v97.4.850. Blood. 2001. PMID: 11159507 - Chemokine receptors and leukocyte trafficking in the mucosal immune system.
Williams IR. Williams IR. Immunol Res. 2004;29(1-3):283-92. doi: 10.1385/IR:29:1-3:283. Immunol Res. 2004. PMID: 15181289 Review. - T lymphocyte trafficking: molecules and mechanisms.
Fu H, Wang A, Mauro C, Marelli-Berg F. Fu H, et al. Front Biosci (Landmark Ed). 2013 Jan 1;18(2):422-40. doi: 10.2741/4111. Front Biosci (Landmark Ed). 2013. PMID: 23276933 Review.
Cited by
- Therapeutic Monoclonal Antibodies against Cancer: Present and Future.
Delgado M, Garcia-Sanz JA. Delgado M, et al. Cells. 2023 Dec 14;12(24):2837. doi: 10.3390/cells12242837. Cells. 2023. PMID: 38132155 Free PMC article. Review. - Lymphocyte CC chemokine receptor 9 and epithelial thymus-expressed chemokine (TECK) expression distinguish the small intestinal immune compartment: Epithelial expression of tissue-specific chemokines as an organizing principle in regional immunity.
Kunkel EJ, Campbell JJ, Haraldsen G, Pan J, Boisvert J, Roberts AI, Ebert EC, Vierra MA, Goodman SB, Genovese MC, Wardlaw AJ, Greenberg HB, Parker CM, Butcher EC, Andrew DP, Agace WW. Kunkel EJ, et al. J Exp Med. 2000 Sep 4;192(5):761-8. doi: 10.1084/jem.192.5.761. J Exp Med. 2000. PMID: 10974041 Free PMC article. - Interleukin-17 directly stimulates tumor infiltrating Tregs to prevent cancer development.
Theune WC, Chen J, Theune EV, Ye X, Ménoret A, Vella AT, Wang K. Theune WC, et al. Front Immunol. 2024 Jun 14;15:1408710. doi: 10.3389/fimmu.2024.1408710. eCollection 2024. Front Immunol. 2024. PMID: 38947320 Free PMC article. - Distinct conformations of the chemokine receptor CCR4 with implications for its targeting in allergy.
Viney JM, Andrew DP, Phillips RM, Meiser A, Patel P, Lennartz-Walker M, Cousins DJ, Barton NP, Hall DA, Pease JE. Viney JM, et al. J Immunol. 2014 Apr 1;192(7):3419-27. doi: 10.4049/jimmunol.1300232. Epub 2014 Feb 21. J Immunol. 2014. PMID: 24563252 Free PMC article. - Prediction of Johne's disease state based on quantification of T cell markers and their interaction with macrophages in the bovine intestine.
Jenvey CJ, Shircliff AL, Obando Marrero E, Stabel JR. Jenvey CJ, et al. Vet Res. 2021 Apr 13;52(1):55. doi: 10.1186/s13567-021-00925-x. Vet Res. 2021. PMID: 33849661 Free PMC article.
References
- Taub D.D., Oppenheim J.J. Chemokines, inflammation and the immune system. Ther. Immunol. 1994;1:229–246. - PubMed
- Fuentes M.E., Durham S.K., Swerdel M.R., Lewin A.C., Barton D.S., Megil J.R., Bravo R., Lira S.A. Controlled recruitment of monocytes and macrophages to specific organs through transgenic expression of monocyte chemoattractant protein-1. J. Immunol. 1995;155:5769–5776. - PubMed
Publication types
MeSH terms
Substances
Grants and funding
- AI37832/AI/NIAID NIH HHS/United States
- R37 GM037734/GM/NIGMS NIH HHS/United States
- DK52978/DK/NIDDK NIH HHS/United States
- DK42166/DK/NIDDK NIH HHS/United States
- R01 GM037734/GM/NIGMS NIH HHS/United States
LinkOut - more resources
Full Text Sources
Other Literature Sources
Molecular Biology Databases
Research Materials
