Chromosomal aberrations in PARP(-/-) mice: genome stabilization in immortalized cells by reintroduction of poly(ADP-ribose) polymerase cDNA - PubMed (original) (raw)
Chromosomal aberrations in PARP(-/-) mice: genome stabilization in immortalized cells by reintroduction of poly(ADP-ribose) polymerase cDNA
C M Simbulan-Rosenthal et al. Proc Natl Acad Sci U S A. 1999.
Abstract
Depletion of poly(ADP-ribose) polymerase (PARP) increases the frequency of recombination, gene amplification, sister chromatid exchanges, and micronuclei formation in cells exposed to genotoxic agents, implicating PARP in the maintenance of genomic stability. Flow cytometric analysis now has revealed an unstable tetraploid population in immortalized fibroblasts derived from PARP(-/-) mice. Comparative genomic hybridization detected partial chromosomal gains in 4C5-ter, 5F-ter, and 14A1-C1 in PARP(-/-)mice and immortalized PARP(-/-)fibroblasts. Neither the chromosomal gains nor the tetraploid population were apparent in PARP(-/-) cells stably transfected with PARP cDNA [PARP(-/-)(+PARP)], indicating negative selection of cells with these genetic aberrations after reintroduction of PARP cDNA. Although the tumor suppressor p53 was not detectable in PARP(-/-) cells, p53 expression was partially restored in PARP(-/-) (+PARP) cells. Loss of 14D3-ter that encompasses the tumor suppressor gene Rb-1 in PARP(-/-) mice was associated with a reduction in retinoblastoma(Rb) expression; increased expression of the oncogene Jun was correlated with a gain in 4C5-ter that harbors this oncogene. These results further implicate PARP in the maintenance of genomic stability and suggest that altered expression of p53, Rb, and Jun, as well as undoubtedly many other proteins may be a result of genomic instability associated with PARP deficiency.
Figures
Figure 1
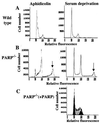
Flow cytometric analysis of immortalized wild-type (A), PARP−/− (B), and PARP−/−(+PARP) (C) fibroblasts. Cells were harvested 5 h after release from aphidicolin-induced G1-S block (Left) or 18 h after release from serum deprivation (Right). Nuclei then were prepared and stained with propidium iodide for flow cytometric analysis. In addition to the two major peaks of nuclei at G0-G1 and G2-M apparent in the DNA histograms of wild-type and PARP−/−(+PARP) cells, the DNA histograms of PARP−/− cells exhibit a third peak corresponding to the G2-M peak of an unstable tetraploid cell population (arrows).
Figure 2
PARP and p53 expression in immortalized wild-type, PARP−/−, and PARP−/−(+PARP) fibroblasts. (A) Cell extracts of wild-type, PARP−/−, and PARP−/−(+PARP) fibroblasts (30 μg protein) were subjected to immunoblot analysis with antibodies to PARP (Top) and to PAR (Middle). RT-PCR was performed with specific human (hPARP) and mouse (mPARP) PARP primers (Bottom). (B) Cell extracts were subjected to immunoblot analysis with mAb to p53 (PAb421) (Top). The blot was stained with Ponceau S to verify equal loading and transfer of proteins in both lanes (Middle). RT-PCR and PCR were performed with specific primers for p53 mRNA and gene (Bottom). The positions of PARP, PAR, p53, and PARP and p53 cDNA are indicated.
Figure 3
CGH average ratio profiles of genomic DNA from liver tissue of wild-type (A) and PARP−/− (B) mice. Average ratio profiles were computed for all chromosomes and used for the mapping of changes in copy number. The three vertical lines to the right of the chromosome ideograms represent values of 0.75, 1, and 1.25 (left to right, respectively) for the fluorescence ratio between the test DNA and the normal control DNA. The ratio profile (curve) was computed as a mean value of at least eight metaphase spreads. A ratio of ≥ 1.25 was regarded as a gain and a ratio of ≤ 0.75 as a loss.
Figure 4
Comparison of the CGH profiles of chromosomes 4, 5, and 14 among PARP−/− mice (A) and immortalized PARP−/− (B) and PARP−/−(+PARP) (C) fibroblasts. Average ratio profiles were computed for all chromosomes from at least eight metaphase spreads as described in Fig. 3, with only the results for chromosomes 4, 5, and 14 shown. PARP−/−(+PARP) fibroblasts did not show the gains at 4C5-ter, 5F-ter, or 14A1-C2 that were apparent in both PARP−/− mice and immortalized PARP−/− cells, although they retained the partial loss at 14D3-ter.
Figure 5
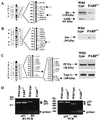
Location of Rb-1 and Jun in chromosomal regions with copy number changes in PARP−/− mice and altered expression of Rb and Jun in these animals. (A) CGH profile of chromosome 14 of the PARP−/− mice showing the loss of 14D3-ter, and the location of Rb-1 and Glud (arrows) on 14D3. Immunoblot analysis with antibodies to Rb and glutamate dehydrogenase (GDH) of tissue extracts from wild-type and PARP−/− mice. (B) CGH profile of chromosome 4 of PARP−/− mice showing the partial gain of 4C5-ter and the location of Jun (arrow) on mouse chromosome 4C5. The immunoblot in A was reprobed with antibodies to Jun. (C) Balanced CGH profile of chromosome 2 of PARP−/− mice and the location of Pcna and TopI genes (arrows) on 2B-C and 2H. The immunoblot in A was reprobed with antibodies to PCNA and to topo I. The positions of Rb (110 kDa), glutamate dehydrogenase (61 kDa), Jun (39 kDa), PCNA (36 kDa), and topo I (100 kDa) are indicated. (D) RT-PCR and PCR analysis of wild-type and PARP−/− mice liver using p53 and Rb-specific primers. The positions of p53 and Rb cDNA (arrows) and of DNA size standards (in kb and bp) are indicated.
References
- Althaus F R, Hilz H, Shall S. ADP-Ribosylation of Proteins. Berlin: Springer; 1985.
- Jacobson M K, Jacobson E L. ADP-Ribose Transfer Reactions: Mechanisms and Biological Significance. New York: Springer; 1989.
- Morgan W, Cleaver J. Mutat Res. 1982;104:361–366. - PubMed
- Burkle A, Heilbronn R, Zur H H. Cancer Res. 1990;50:5756–5760. - PubMed
Publication types
MeSH terms
Substances
LinkOut - more resources
Full Text Sources
Other Literature Sources
Molecular Biology Databases
Research Materials
Miscellaneous


