Expression of the voltage-gated chloride channel ClC-2 in rod bipolar cells of the rat retina - PubMed (original) (raw)
Expression of the voltage-gated chloride channel ClC-2 in rod bipolar cells of the rat retina
R Enz et al. J Neurosci. 1999.
Abstract
Voltage-gated chloride channels (ClC) are highly conserved during evolution and appear to participate in a variety of physiological functions. Recently, ClC-2 was proposed to play a role in stabilizing the chloride equilibrium potential near or below the resting membrane potential in neurons expressing ligand-gated chloride channels. Because rod bipolar cells in mammalian retina express three forms of inhibitory ligand-gated chloride channels, we decided to study ClC-2 localization and function in the rat retina. RNA encoding ClC-1, -2, -3, -4, and -5 was detected by reverse transcription-PCR in the rat retina. ClC-2-specific antibodies identified protein on cell bodies and in synaptic layers. Double-immunofluorescence staining revealed that intense ClC-2 immunoreactivity colocalized with PKC-stained rod bipolar cells. Patch-clamp experiments performed with individual rod bipolar cells demonstrated the presence of a time-dependent, inwardly rectified current activated at hyperpolarizing membrane potentials. This current demonstrated selectivity for different anions (Cl(-) > I(-) > gluconate), was inhibited by Cd(2+), and was minimally reduced by 4,4'-diisothiocyanatostilbene-2,2'-disulphonic acid. These features are consistent with currents generated by ClC-2 channels. Our data indicate that functional ClC-2 channels are present in retinal rod bipolar cells and support a role for ClC-2 in maintaining Cl(-) homeostasis in neurons with ligand-gated chloride channels.
Figures
Fig. 1.
Expression of RNA encoding voltage-gated chloride channels in the rat retina. Ethidium bromide stained RT-PCR products amplified from rat retina RNA using primers specific for seven different ClC genes (A) and primers flanking exon 20 of the rat ClC-2 gene (B). The identity of all PCR products was determined by DNA sequencing. A, The ClC type is indicated above the agarose gel, and the 600 bp fragment of a 100 bp ladder (lane M) is shown on the left. The faintly stained fragments in_lane K2_ and lane 5 are attributable to nonspecific amplification. B, The exon 20 splice variant of rat ClC-2 was detected in retinal RNA (+ lane). The expected sizes of fragments amplified from ClC-2 transcripts with exon 20 (202 bp) and without exon 20 (142 bp) are indicated on the_right_. The fragment without an indicated size is because of formation of a heteroduplex of the two smaller DNA fragments. Absence of amplified product in the reaction without reverse transcriptase (− lane) excluded contamination.
Fig. 2.
Immunohistochemical detection of ClC-2 in the rat retina. A, A fluorescence micrograph of a vertical cryostat section through the rat retina was incubated with antibodies specific for ClC-2 and visualized using secondary antibodies coupled to Cy3. Immunofluorescence could be seen throughout the retina, most prominent at cell bodies present in the outer half of the INL and in the IPL. Scale bar, 25 μm. B, Control experiment in which only the secondary antisera was used. Nonspecific staining of photoreceptor inner segments can be seen. C, Retinal layers are shown using Nomarski optics. IS, Inner segments of photoreceptors; ONL, outer nuclear layer; OPL, outer plexiform layer; INL, inner nuclear layer; IPL, inner plexiform layer;GCL, ganglion cell layer.
Fig. 3.
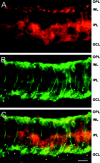
Localization of ClC-2 on rod bipolar cells.A, Fluorescence micrographs of a vertical cryostat section labeled with a ClC-2-specific antiserum (Cy3-coupled secondary antisera, red fluorescence). B, Incubation of the same section as in A with antisera specific for the α subunit of PKC, which identifies rod bipolar cells (FITC-coupled secondary antisera, green fluorescence).C, Double exposure of the section revealed staining for ClC-2 on the upper half of rod bipolar cell bodies (yellow fluorescence) and on rod bipolar cell axon terminal systems (stars). Scale bar, 25 μm.
Fig. 4.
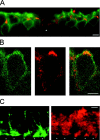
Subcellular distribution of ClC-2 on rod bipolar cells. A, Enlarged view of a vertical cryostat section immunolabeled as in Figure 3. Cell bodies of rod bipolar cells were located in the outer half of the inner nuclear layer (green fluorescence). ClC-2 immunoreactivity (red fluorescence) was present on every cell body, resulting in yellow signals. In addition, ClC-2 staining outlined other cells (star). B, Horizontal single-section confocal fluorescence micrographs of a rod bipolar cell body double-immunolabeled as described in Figure 3. PKC immunoreactivity was predominantly localized to the cell membrane (left, green fluorescence). Expression of ClC-2 is shown in the middle (red fluorescence). The double exposure demonstrated that ClC-2 immunoreactivity seemed to be mostly present within or near the cell membrane (right, yellow).C, Enlarged view of the lower border of the IPL of double-labeled vertical cryostat sections. Axon terminal systems of rod bipolar cells were double-immunolabeled with antibodies recognizing PKC (left, green fluorescence). ClC-2 immunoreactivity (red fluorescence) was present at identical positions (stars). Furthermore, ClC-2 immunoreactivity was observed at other regions within the IPL. Scale bars: A, C, 10 μm; B, 5 μm.
Fig. 5.
Hyperpolarization-activated chloride currents on isolated rod bipolar cells. A hyperpolarizing voltage step protocol (left) generated inwardly rectified, noninactivating currents from an isolated rod bipolar cell (middle). Data recorded from 12 different bipolar cells are summarized in a current–voltage plot (right). The current amplitudes have been normalized (I/_I_c) to the currents at −140 mV (_I_c; see Materials and Methods for details).
Fig. 6.
Electrophysiological characterization of hyperpolarization-activated currents in rod bipolar cells. A, Representative current tracings of a single rod bipolar cell recorded in different anionic solutions. Current amplitudes and the degree of inward rectification decreased in NaI, further decreased in Na gluconate, and returned to original levels in NaCl. The current–voltage plot on the _right_represents calculated mean data. Currents were normalized (I/_I_c) using current amplitudes at −120 mV in NaCl (_I_c). The voltage protocol was the same as described in Figure 5, except that the applied potentials ranged from + 60 to −120 mV. B, Representative current tracings of a single rod bipolar cell exposed to extracellular DIDS or CdSO4. The first and fourth recordings were performed in symmetrical chloride solutions alone. The voltage-activated currents were partially inhibited by the application of 500 μ
m
DIDS and substantially reduced by 500 μ
m
CdSO4. Inhibition of each compound was reversible. The current–voltage plot of normalized mean data are shown at the right. Currents have been normalized as described in A.
Similar articles
- Functional and molecular characterization of a volume-sensitive chloride current in rat brain endothelial cells.
von Weikersthal SF, Barrand MA, Hladky SB. von Weikersthal SF, et al. J Physiol. 1999 Apr 1;516 ( Pt 1)(Pt 1):75-84. doi: 10.1111/j.1469-7793.1999.075aa.x. J Physiol. 1999. PMID: 10066924 Free PMC article. - ClC-3 is a candidate of the channel proteins mediating acid-activated chloride currents in nasopharyngeal carcinoma cells.
Wang L, Ma W, Zhu L, Ye D, Li Y, Liu S, Li H, Zuo W, Li B, Ye W, Chen L. Wang L, et al. Am J Physiol Cell Physiol. 2012 Jul 1;303(1):C14-23. doi: 10.1152/ajpcell.00145.2011. Epub 2012 Apr 11. Am J Physiol Cell Physiol. 2012. PMID: 22496242 - ClC-2 chloride channels contribute to HTC cell volume homeostasis.
Roman RM, Smith RL, Feranchak AP, Clayton GH, Doctor RB, Fitz JG. Roman RM, et al. Am J Physiol Gastrointest Liver Physiol. 2001 Mar;280(3):G344-53. doi: 10.1152/ajpgi.2001.280.3.G344. Am J Physiol Gastrointest Liver Physiol. 2001. PMID: 11171616 - The ClC-3 chloride channels in cardiovascular disease.
Duan DD. Duan DD. Acta Pharmacol Sin. 2011 Jun;32(6):675-84. doi: 10.1038/aps.2011.30. Epub 2011 May 23. Acta Pharmacol Sin. 2011. PMID: 21602838 Free PMC article. Review. - Phenomics of cardiac chloride channels.
Duan DD. Duan DD. Compr Physiol. 2013 Apr;3(2):667-92. doi: 10.1002/cphy.c110014. Compr Physiol. 2013. PMID: 23720326 Free PMC article. Review.
Cited by
- Chloride channelopathies of ClC-2.
Bi MM, Hong S, Zhou HY, Wang HW, Wang LN, Zheng YJ. Bi MM, et al. Int J Mol Sci. 2013 Dec 27;15(1):218-49. doi: 10.3390/ijms15010218. Int J Mol Sci. 2013. PMID: 24378849 Free PMC article. Review. - Expression of voltage-gated chloride channels in human glioma cells.
Olsen ML, Schade S, Lyons SA, Amaral MD, Sontheimer H. Olsen ML, et al. J Neurosci. 2003 Jul 2;23(13):5572-82. doi: 10.1523/JNEUROSCI.23-13-05572.2003. J Neurosci. 2003. PMID: 12843258 Free PMC article. - Evidence that different cation chloride cotransporters in retinal neurons allow opposite responses to GABA.
Vardi N, Zhang LL, Payne JA, Sterling P. Vardi N, et al. J Neurosci. 2000 Oct 15;20(20):7657-63. doi: 10.1523/JNEUROSCI.20-20-07657.2000. J Neurosci. 2000. PMID: 11027226 Free PMC article. - ClC-2 regulation of intestinal barrier function: Translation of basic science to therapeutic target.
Jin Y, Blikslager AT. Jin Y, et al. Tissue Barriers. 2015 Nov 13;3(4):e1105906. doi: 10.1080/21688370.2015.1105906. eCollection 2015 Oct-Dec. Tissue Barriers. 2015. PMID: 26716076 Free PMC article. Review. - A synthetic prostone activates apical chloride channels in A6 epithelial cells.
Bao HF, Liu L, Self J, Duke BJ, Ueno R, Eaton DC. Bao HF, et al. Am J Physiol Gastrointest Liver Physiol. 2008 Aug;295(2):G234-51. doi: 10.1152/ajpgi.00366.2007. Epub 2008 May 29. Am J Physiol Gastrointest Liver Physiol. 2008. PMID: 18511742 Free PMC article.
References
- Barry PH. JPCalc, a software for calculating liquid junction potential corrections in patch-clamp, intracellular epithelial and bilayer measurements and for correcting junction potential measurements. J Neurosci Methods. 1994;51:107–116. - PubMed
- Bormann J. U-tube drug application. In: Kettenmann H, Grantyn R, editors. Practical electrophysiological methods. Wily-Liss; New York: 1992. pp. 136–140.
- Carew MA, Thorn P. Identification of ClC-2-like chloride currents in pig pancreatic acinar cells. Pflügers Arch. 1996;433:84–90. - PubMed
Publication types
MeSH terms
Substances
LinkOut - more resources
Full Text Sources
Other Literature Sources


