Behaviour of NMDA and AMPA receptor-mediated miniature EPSCs at rat cortical neuron synapses identified by calcium imaging - PubMed (original) (raw)
Behaviour of NMDA and AMPA receptor-mediated miniature EPSCs at rat cortical neuron synapses identified by calcium imaging
M Umemiya et al. J Physiol. 1999.
Abstract
1. Simultaneous recording of intracellular calcium concentration at a synapse and synaptic currents from the cell body allows mapping of miniature excitatory postsynaptic currents (mEPSCs) to single synapses. 2. In the absence of extracellular Mg2+, 77 % of synapses had mEPSCs with fast and slow components, attributed to AMPA- and NMDA-type glutamate receptors, respectively. The remainder of synapses (23 %) had mEPSCs that lacked a fast component; these responses were attributed to NMDA receptors. 3. A strong positive correlation between the amplitude of the calcium transient and the NMDA receptor-mediated mEPSC was observed, indicating that the mEPSCs originate from an identified synapse. 4. At synapses that had both mEPSC components, the AMPA receptor component was positively correlated with charge influx mediated by NMDA receptors during repeated synaptic events. No periodic failure in the AMPA receptor mEPSC was observed at synapses expressing both receptor components. 5. A significant positive correlation between the mean amplitudes of NMDA and AMPA receptor components of mEPSCs is observed across different synapses. 6. We suggest that factors effecting both receptor classes, such as the amount of transmitter in synaptic vesicles, might contribute to the variation in mEPSC amplitude during repeated miniature events at a single synapse. Although the average postsynaptic response at different synapses can vary in amplitude, there appears to be a mechanism to keep the ratio of each receptor subtype within a narrow range.
Figures
Figure 1. Recording of mEPSCs from an identified synapse
A, bright field image of neurons. The arrow indicates the neuron that was recorded from and the arrowhead indicates an adjacent neuron. Scale bar, 20 μm. B, higher power Mag-fura-2 image of the neuron of interest. The arrow indicates the putative synapse. Scale bar, 2 μm. C, time course of MSCTs (top trace) and mEPSCs (bottom trace). Two MSCTs were observed within the 15 s of data shown. The time course of intracellular calcium concentration is estimated by normalizing the fluorescence intensity of Fluo-3 to Mag-fura-2 fluorescence. The middle panel shows the line-scan image of Fluo-3 fluorescence in the dendrite. The white arrow indicates the synapse location. Scale bar, 5 μm. Black arrows indicate mEPSCs associated with the MSCT on the line-scan image. The first mEPSC, along with the associated MSCT, is shown on a higher time scale in D (top trace, mEPSCs; bottom trace, MSCTs).
Figure 2. mEPSCs identified at a single synapse by correlated calcium imaging
A, time course of the mean MSCT and mean mEPSC from 40 synaptic events. The mEPSCs were aligned by the first point of MSCTs (alignment subject to ± 33 ms timing jitter). The shaded area indicates a 60 ms period of two video frames at the MSCT onset and the previous frame. B, onset and decay time course of the mean mEPSC at an identified synapse. The decay phase of the mean mEPSC was fitted to a sum of two exponential components (thin line). The dotted line is the exponential decay at a time constant of 2·0 ms from the peak of the mean trace. The dashed line is the linear activation and the exponential decay of the slow component (time to peak, 7 ms; decay time constant, 53 ms). The shaded area indicates a 6 ms period following the peak that was excluded for the quantification of the amplitude of NMDAR component (measured between 6–56 ms). A and B are averages of recordings from the same neuron. C, time course of mEPSCs in the presence and absence of CNQX (5 μM). Each current trace is the mean of 14 mEPSCs. The decay time course of the current was fitted to a sum of two exponential components with time constants of 3·0 and 40 ms. D, time course of a mean AMPA receptor-mediated mEPSC in the presence of AP5 (50 μM). The current trace is the mean of 10 events. The decay time course of the current was fitted to a single exponential component with a time constant of 2·5 ms (continuous line). The shaded area indicates the 7·5 ms duration that was excluded from the measurement of the charge mediated by NMDARs.
Figure 3. Behaviour of repeated mEPSCs at a single synapse
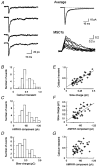
A, individual mEPSC traces and the mean mEPSC at a synapse identified by correlated calcium imaging. The individual traces are aligned at the onset. At this synapse, 40 mEPSCs were observed. The mean trace is fitted to sum of two exponential components with decay time constants of 2·3 and 52 ms (continuous line). The time course (moving average of 5 points) of nine superimposed MSCTs is shown in the right lower panel. B, amplitude histogram of MSCTs. C, amplitude histogram of the AMPAR components of mEPSCs. D, amplitude histogram of the charge mediated by the slow component, calculated as an integral of the current amplitude between 6·9 and 56·9 ms after the peak. E, scatter plot of charge influx mediated by the slow component versus the MSCT amplitude. F, scatter plot of the amplitude of the AMPAR component versus charge influx mediated by the slow component. G, scatter plot of the amplitude of the AMPAR component versus the MSCT amplitude. r values for the above relationships were 0·87, 0·70 and 0·51, respectively.
Figure 4. Relationship between peak mEPSC amplitude and slow mEPSC amplitude across different synapses
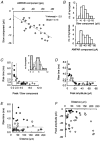
A, scatter plot of the amplitude of the AMPAR and NMDAR components of averaged mEPSCs at single synapses (r = 0·75, 23 synapses, 11 cells). B, amplitude histogram of the AMPAR and NMDAR components. C, scatter plot of the ratio of the fast component (peak) amplitude and the slow component amplitude versus the rise time. The dashed lines indicate the criteria of AMPAR dominant synapses; the rise time of 1·4 ms and a peak/slow ratio of two. The inset is a histogram of the ratios of the peak amplitude of mEPSCs to slow component amplitude. The dotted line shows the distribution of synapses that did not fall in the two groups. The smooth line shows the normal distribution of AMPAR dominant synapses calculated from the mean and the standard deviation. D, scatter plot of the peak amplitude of mEPSCs versus the rise time. The dashed line indicates a rise time of 1·4 ms. E, scatter plot of the distance of a synapse from the cell body versus the rise time. The dashed line indicates a rise time of 1·4 ms. F, scatter plot of the distance of the synapse from the cell body versus the peak amplitude of mEPSCs. ♦, NMDAR dominant synapses; ⋄, AMPAR dominant synapses; ○, synapses that did not fall within the two categories.
Figure 5. NMDA receptor dominant synapse
A, mEPSCs at NMDAR dominant synapses. The mean mEPSC (n = 15) from a synapse identified by correlated calcium imaging that lacked a fast component of the mEPSC. Top trace, the mean mEPSC was fitted to a single exponential function with a time constant of 45 ms. Bottom traces, three examples of individual mEPSCs (raw data). Arrows indicate the beginning of the video frame of MSCT onset. B, effect of CNQX (5 μM) on mEPSCs at the NMDAR dominant synapse. The mean mEPSCs in the absence and presence of CNQX are superimposed. The charges mediated by mEPSCs in the absence and presence of CNQX (5 μM) were 0·47 ± 0·06 pC (n = 15 in 225 s) and 0·45 ± 0·09 pC (n = 8 in 120 s) (P > 0·8), respectively. C, a NMDAR dominant synapse and a synapse with biphasic mEPSCs (both NMDAR and AMPAR components) on the same dendrite at a more distal site. Traces are the means of 11 and 6 mEPSCs, for a and b, respectively. Scale bar, 10 μm.3
Similar articles
- Activation of silent synapses by rapid activity-dependent synaptic recruitment of AMPA receptors.
Liao D, Scannevin RH, Huganir R. Liao D, et al. J Neurosci. 2001 Aug 15;21(16):6008-17. doi: 10.1523/JNEUROSCI.21-16-06008.2001. J Neurosci. 2001. PMID: 11487624 Free PMC article. - A calcium-dependent feedback mechanism participates in shaping single NMDA miniature EPSCs.
Umemiya M, Chen N, Raymond LA, Murphy TH. Umemiya M, et al. J Neurosci. 2001 Jan 1;21(1):1-9. doi: 10.1523/JNEUROSCI.21-01-00001.2001. J Neurosci. 2001. PMID: 11150313 Free PMC article. - Synaptic current kinetics in a solely AMPA-receptor-operated glutamatergic synapse formed by rat retinal ganglion neurons.
Taschenberger H, Engert F, Grantyn R. Taschenberger H, et al. J Neurophysiol. 1995 Sep;74(3):1123-36. doi: 10.1152/jn.1995.74.3.1123. J Neurophysiol. 1995. PMID: 7500138 - Glutamatergic receptors at developing synapses: the role of GluN3A-containing NMDA receptors and GluA2-lacking AMPA receptors.
Yuan T, Bellone C. Yuan T, et al. Eur J Pharmacol. 2013 Nov 5;719(1-3):107-111. doi: 10.1016/j.ejphar.2013.04.056. Epub 2013 Jul 17. Eur J Pharmacol. 2013. PMID: 23872415 Review. - AMPA receptor trafficking at excitatory synapses.
Bredt DS, Nicoll RA. Bredt DS, et al. Neuron. 2003 Oct 9;40(2):361-79. doi: 10.1016/s0896-6273(03)00640-8. Neuron. 2003. PMID: 14556714 Review.
Cited by
- GABA-Mediated Inactivation of Medial Prefrontal and Agranular Insular Cortex in the Rat: Contrasting Effects on Hunger- and Palatability-Driven Feeding.
Baldo BA, Spencer RC, Sadeghian K, Mena JD. Baldo BA, et al. Neuropsychopharmacology. 2016 Mar;41(4):960-70. doi: 10.1038/npp.2015.222. Epub 2015 Jul 23. Neuropsychopharmacology. 2016. PMID: 26202102 Free PMC article. - Distinguishing Linear vs. Non-Linear Integration in CA1 Radial Oblique Dendrites: It's about Time.
Gómez González JF, Mel BW, Poirazi P. Gómez González JF, et al. Front Comput Neurosci. 2011 Nov 14;5:44. doi: 10.3389/fncom.2011.00044. eCollection 2011. Front Comput Neurosci. 2011. PMID: 22171217 Free PMC article. - Developmental increase in vesicular glutamate content does not cause saturation of AMPA receptors at the calyx of Held synapse.
Yamashita T, Ishikawa T, Takahashi T. Yamashita T, et al. J Neurosci. 2003 May 1;23(9):3633-8. doi: 10.1523/JNEUROSCI.23-09-03633.2003. J Neurosci. 2003. PMID: 12736334 Free PMC article. - Parsing Out the Variability of Transmission at Central Synapses Using Optical Quantal Analysis.
Soares C, Trotter D, Longtin A, Béïque JC, Naud R. Soares C, et al. Front Synaptic Neurosci. 2019 Aug 14;11:22. doi: 10.3389/fnsyn.2019.00022. eCollection 2019. Front Synaptic Neurosci. 2019. PMID: 31474847 Free PMC article. - Nanoscale rules governing the organization of glutamate receptors in spine synapses are subunit specific.
Hruska M, Cain RE, Dalva MB. Hruska M, et al. Nat Commun. 2022 Feb 17;13(1):920. doi: 10.1038/s41467-022-28504-4. Nat Commun. 2022. PMID: 35177616 Free PMC article.
References
- Asztely F, Erdemli G, Kullmann DM. Extrasynaptic glutamate spillover in the hippocampus: dependence on temperature and the role of active glutamate uptake. Neuron. 1997;18:281–293. - PubMed
- Bear MF, Malenka RC. Synaptic plasticity: LTP and LTD. Current Opinion in Neurobiology. 1994;4:389–399. - PubMed
- Bekkers JM, Stevens CF. NMDA and non-NMDA receptors are co-localized at individual excitatory synapses in cultured rat hippocampus. Nature. 1989;341:230–233. - PubMed
- Bekkers JM, Stevens CF. Cable properties of cultured hippocampal neurons determined from sucrose-evoked miniature EPSCs. Journal of Neurophysiology. 1996;75:1250–1255. - PubMed
Publication types
MeSH terms
Substances
LinkOut - more resources
Full Text Sources


