Depletion of calcium in the synaptic cleft of a calyx-type synapse in the rat brainstem - PubMed (original) (raw)
Depletion of calcium in the synaptic cleft of a calyx-type synapse in the rat brainstem
J G Borst et al. J Physiol. 1999.
Abstract
1. A new form of synaptic depression of excitatory synaptic transmission was observed when making voltage-clamp recordings from large presynaptic terminals, the calyces of Held and postsynaptic cells, the principal cells of the medial nucleus of the trapezoid body (MNTB), in slices of the rat auditory brainstem. 2. A short (100 ms) depolarization of the postsynaptic cell to 0 mV reduced the amplitude of the EPSCs by 35 +/- 5 % (n = 7), measured at 10 ms following the depolarization. Recovery occurred within 0.5 s. 3. The reduction of the EPSCs was most probably due to reduced presynaptic calcium influx, since postsynaptic depolarization reduced presynaptic calcium or barium currents. Conversely, presynaptic depolarization also reduced postsynaptic calcium or barium influx, under conditions where transmitter release was minimal. 4. The calcium currents and the postsynaptic depolarization-induced suppression of synaptic transmission recovered with a similar time course, suggesting that this form of synaptic depression was, most probably, due to depletion of Ca2+ in the synaptic cleft. 5. We conclude that when the Ca2+ influx into the pre- or postsynaptic cell is large, extracellular Ca2+ is depleted. Under these conditions, the Ca2+ concentration in the synaptic cleft is a sensitive indicator of the level of synaptic activity. However, the synaptic cleft is less sensitive to Ca2+ depletion than predicted from its estimated volume.
Figures
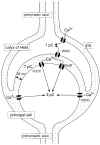
Figure 1. Schematic view of pre- and postsynaptic calcium influx during synaptic transmission in the MNTB
The dotted area represents the extracellular volume. Ca2+ influx is given as charge entry per action potential.
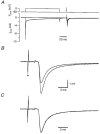
Figure 2. Postsynaptic depolarization-induced synaptic depression
At an interval of 20 ms following a 100 ms depolarization from −80 mV to 0 mV of the postsynaptic cell, an EPSC was evoked by extracellular afferent stimulation. Postsynaptic pipette solution contained Cs+ and 10 mM BAPTA; Ca2+ was the charge carrier. A, top, postsynaptic voltage protocol. Arrow indicates the time of afferent stimulation. Bottom, postsynaptic currents. The step to 0 mV evoked a large inward current. B, EPSCs evoked in A shown at higher resolution. The EPSC following the depolarizing step had a similar time course but a decreased amplitude to that evoked in the absence of a depolarizing step. Small dot indicates stimulation artifact. C, same as B, except that the 2 EPSCs were scaled to the same peak amplitude.
Figure 3. Recovery from postsynaptic depolarization-induced synaptic depression
Average effect of a depolarizing step to 0 mV (•; n = 4–7) or 80 mV (○; n = 3) on EPSC size at different intervals after the step. Before averaging, the EPSC amplitudes were normalized to the amplitude of the EPSCs in the absence of a prepulse in the same experiment. Continuous line is the fit with an exponential function with a time constant of 175 ms.
Figure 4. Postsynaptic depolarization transitorily decreased presynaptic Ba2+ influx
Both the presynaptic terminal (top 2 panels) and the postsynaptic cell (bottom two panels) were voltage clamped with a 0·5 s train of identical APWs at 100 Hz. After 10 action potentials, the postsynaptic train was interrupted for 100 ms and either the membrane potential was kept at −90 mV (left panel) or a 100 ms step to −20 mV from the holding potential of −90 mV was applied (right panel). Bottom panel shows postsynaptic barium currents. Arrow points at the transient decrease in presynaptic barium currents that was induced by the postsynaptic Ba2+ influx.
Figure 5. Time course of the effect of a postsynaptic depolarization on presynaptic Ba2+ influx
Mean peak amplitude of the presynaptic barium current during APWs in 5 experiments, using the same protocol as shown in Fig. 4. Currents were normalized to the response to the first APW of each train. The presynaptic barium currents decreased during the depolarizing step in the postsynaptic cell (•). The depolarizing step is indicated by the filled bar. No effect was seen in the absence of a depolarizing step (○). Continuous line is a fit with a single exponential function with a time constant of 60 ms. Interval between trains was 60 s. Postsynaptic cell contained 10 mM BAPTA, presynaptic terminal contained 1 mM fura-2.
Figure 6. Current-dependent decrease of pre- and postsynaptic calcium currents during presynaptic Ca2+ influx
A, a 100 ms step to −40, 0 or 60 mV in the presynaptic terminal was followed after 10 ms and after 115 ms by a 5 ms step to 0 mV applied simultaneously to both the pre- (top traces, _V_pre) and the postsynaptic recording (third trace from top, _V_post). Presynaptic currents are shown in the family of traces second from top (_I_pre), postsynaptic currents in the family of traces fourth from top (_I_post). The first 0·6 ms of the postsynaptic capacitative artifact has been blanked. Data were digitally filtered to 1 kHz. Terminal contained 10 mM BAPTA. The dashed lines indicate the difference in the currents evoked during the first test pulse in the absence or presence of a prepulse to 0 mV. B, peak amplitudes of the presynaptic calcium currents measured during the prepulse and during the test pulses to 0 mV. Test pulses were given 10 ms (•) and 115 ms (▪) after the prepulse (▴). C, peak amplitudes of the postsynaptic calcium currents measured during the test pulse to 0 mV at 10 ms (○) and at 115 ms (□) following the prepulses applied to the calyx.
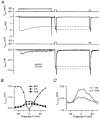
Figure 7. Calcium dependence of synaptic transmission in the presence of 10 mM BAPTA in the terminal
Same experiment as illustrated in Fig. 6. A, simultaneous recording of presynaptic calcium currents (middle) and EPSCs (bottom) during presynaptic voltage steps to different potentials (top). For the calcium currents and the EPSCs the bottom trace is the step to 0 mV and the top trace is the step to 50 mV. B, peak amplitude of the presynaptic calcium current during the prepulse versus voltage (•, left axis) and mean amplitude of the EPSC evoked by the prepulse measured between 5 and 10 ms after the onset of the presynaptic voltage step (○, right axis). C, peak amplitude of presynaptic calcium currents and EPSC amplitudes during the prepulse, plotted on a double-logarithmic scale. Slope of the straight line is 3·3.
Figure 8. Calcium charge inside the cleft as a function of the membrane surface charge density
The calcium charge inside the volume of the cleft for co-ordinated binding (dashed line) and diffuse binding (continuous line) is plotted as a function of the membrane surface charge density in electronic units per nanometre squared. The surface charge density of the membranes and the calcium charge were obtained by integrating the Poisson-Boltzmann equation (Bers et al. 1985). For this figure, the bulk concentrations of potassium, calcium and chloride ions are 150, 2 and 154 mM, respectively. The geometry of the synaptic cleft is as described in the Discussion.
Similar articles
- Neurosteroid pregnenolone sulfate enhances glutamatergic synaptic transmission by facilitating presynaptic calcium currents at the calyx of Held of immature rats.
Hige T, Fujiyoshi Y, Takahashi T. Hige T, et al. Eur J Neurosci. 2006 Oct;24(7):1955-66. doi: 10.1111/j.1460-9568.2006.05080.x. Epub 2006 Oct 16. Eur J Neurosci. 2006. PMID: 17040476 - Facilitation of presynaptic calcium currents in the rat brainstem.
Borst JG, Sakmann B. Borst JG, et al. J Physiol. 1998 Nov 15;513 ( Pt 1)(Pt 1):149-55. doi: 10.1111/j.1469-7793.1998.149by.x. J Physiol. 1998. PMID: 9782166 Free PMC article. - Pre- and postsynaptic whole-cell recordings in the medial nucleus of the trapezoid body of the rat.
Borst JG, Helmchen F, Sakmann B. Borst JG, et al. J Physiol. 1995 Dec 15;489 ( Pt 3)(Pt 3):825-40. doi: 10.1113/jphysiol.1995.sp021095. J Physiol. 1995. PMID: 8788946 Free PMC article. - Estimation of quantal parameters at the calyx of Held synapse.
Sakaba T, Schneggenburger R, Neher E. Sakaba T, et al. Neurosci Res. 2002 Dec;44(4):343-56. doi: 10.1016/s0168-0102(02)00174-8. Neurosci Res. 2002. PMID: 12445623 Review. - The calyx of Held.
Schneggenburger R, Forsythe ID. Schneggenburger R, et al. Cell Tissue Res. 2006 Nov;326(2):311-37. doi: 10.1007/s00441-006-0272-7. Epub 2006 Aug 8. Cell Tissue Res. 2006. PMID: 16896951 Review.
Cited by
- The Cav3-Kv4 complex acts as a calcium sensor to maintain inhibitory charge transfer during extracellular calcium fluctuations.
Anderson D, Engbers JD, Heath NC, Bartoletti TM, Mehaffey WH, Zamponi GW, Turner RW. Anderson D, et al. J Neurosci. 2013 May 1;33(18):7811-24. doi: 10.1523/JNEUROSCI.5384-12.2013. J Neurosci. 2013. PMID: 23637173 Free PMC article. - An inhibitory effect of extracellular Ca2+ on Ca2+-dependent exocytosis.
Xiong W, Liu T, Wang Y, Chen X, Sun L, Guo N, Zheng H, Zheng L, Ruat M, Han W, Zhang CX, Zhou Z. Xiong W, et al. PLoS One. 2011;6(10):e24573. doi: 10.1371/journal.pone.0024573. Epub 2011 Oct 18. PLoS One. 2011. PMID: 22028769 Free PMC article. - New insights into molecular players involved in neurotransmitter release.
Ariel P, Ryan TA. Ariel P, et al. Physiology (Bethesda). 2012 Feb;27(1):15-24. doi: 10.1152/physiol.00035.2011. Physiology (Bethesda). 2012. PMID: 22311967 Free PMC article. Review. - Neuronal network analyses: premises, promises and uncertainties.
Parker D. Parker D. Philos Trans R Soc Lond B Biol Sci. 2010 Aug 12;365(1551):2315-28. doi: 10.1098/rstb.2010.0043. Philos Trans R Soc Lond B Biol Sci. 2010. PMID: 20603354 Free PMC article. Review. - Spatial buffering during slow and paroxysmal sleep oscillations in cortical networks of glial cells in vivo.
Amzica F, Massimini M, Manfridi A. Amzica F, et al. J Neurosci. 2002 Feb 1;22(3):1042-53. doi: 10.1523/JNEUROSCI.22-03-01042.2002. J Neurosci. 2002. PMID: 11826133 Free PMC article.
References
- Augustine GJ, Eckert R. Calcium-dependent inactivation of presynaptic calcium channels. Society for Neuroscience Abstracts. 1984;10:194.
- Bers DM. Early transient depletion of extracellular Ca during individual cardiac muscle contractions. American Journal of Physiology. 1983;244:H462–468. - PubMed
Publication types
MeSH terms
Substances
LinkOut - more resources
Full Text Sources
Miscellaneous


