Massive apoptosis of thymocytes in T-cell-deficient Id1 transgenic mice - PubMed (original) (raw)
Massive apoptosis of thymocytes in T-cell-deficient Id1 transgenic mice
D Kim et al. Mol Cell Biol. 1999 Dec.
Abstract
Id1 is an inhibitor of a group of basic helix-loop-helix transcription factors, collectively called E proteins, which includes E12, E47, E2-2, and HEB. We have generated transgenic mice in which Id1 is specifically expressed in T cells. The total number of thymocytes in these mice is less than 4% of that in wild-type mice. The majority of the transgenic thymocytes are CD4 and CD8 double negative and bear the cell surface markers of multipotent progenitor cells. A small number of thymocytes, however, differentiate into CD4 or CD8 single-positive T cells, which also display different characteristics from their wild-type counterparts. More importantly, apoptotic cells constitute about 50% of the total thymocytes. These apoptotic thymocytes have rearranged their T-cell receptor genes, suggesting that they are differentiating T cells. This finding has raised the possibility that the T-cell deficiency in Id1 transgenic mice is the result of a massive apoptosis of differentiating T cells triggered by Id1 expression as opposed to a developmental block at the earliest progenitor stage. The progenitor cells accumulated in the transgenic mice might have survived because they are not susceptible to the apoptotic signals. Despite the massive cell death of the thymocytes at young ages, Id1 transgenic mice frequently develop T-cell lymphoma later in their life span, and lymphomagenesis appears to occur at different stages of T-cell development. Taken together, our data suggest that E proteins, being the targets of Id1, are essential regulators for normal T-cell differentiation and tumor suppression.
Figures
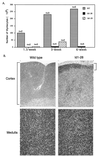
FIG. 1
(A) Reduced cellularity in the thymuses of Id-1 transgenic mice. Unpurified viable thymocytes were counted with a hemocytometer. The numbers of cells per thymus are the average for n wild-type (WT) or Id1-28 and Id1-29 transgenic mice at the indicated ages. (B). Hematoxylin and eosin stain of wild-type and Id1-28 transgenic thymus sections.
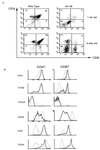
FIG. 2
FACS analyses of cells from Id1 transgenic mice. (A) CD4 and CD8 profiles of the wild-type and transgenic littermates at the indicated ages. The percentage of each cell population is shown in each quadrant. (B) Further analysis of CD4+ and CD8+ single-positive thymocytes. Thymocytes from 5-week-old mice were stained with TC-CD4 and PE-CD8 together with FITC-conjugated antibodies as indicated. The CD4+ and CD8+ populations were defined as shown in panel A. The expression of each indicated cell surface marker is plotted as fluorescence intensity versus cell number (different scales were used for wild-type and transgenic cells). The profiles of the wild-type mice are shown as thick lines, and those of the Id1 transgenic mice are shown as thin lines. (C) Analyses of Ficoll-purified spleen cells from 5-week-old mice as described in panel B. The percentage of CD4+ and CD8+ single-positive cells are shown on top of the boxes.
FIG. 3
Further characterization of CD4 and CD8 DN cells. Thymocytes from wild-type (WT) and transgenic littermates at the indicated ages were stained with TC-CD4 and TC-CD8 together with PE- and FITC-conjugated antibodies as indicated. The TC-negative population was gated for these analyses.
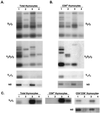
FIG. 4
TCR rearrangement. Total and sorted thymocytes (labeled at the top of each panel) from wild-type and transgenic littermates at the indicated ages were used to prepare DNA for PCR analyses. Thymocytes from wild-type and transgenic (lanes 1 and 3) mice and their respective 10-fold-diluted samples (lanes 2 and 4) were used in PCRs to detect TCR rearrangement events as indicated. The PCR product of the Id2 gene served as a control for the amount of DNA present in each sample. The PCR products were analyzed by Southern blotting.
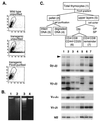
FIG. 5
Apoptosis in the Id1 transgenic thymus. (A) Forward- and side-scatter analysis of thymocytes with or without Ficoll purification as indicated. Live cells are circled. (B) Electrophoresis of DNA from wild-type and transgenic unpurified thymocytes (lanes 1 and 2), transgenic thymocytes in the pellet after centrifugation on Ficoll (lane 3), and transgenic thymocytes in the supernatant (lane 4). (C) TCR rearrangement in different fractions of thymocytes in 10-day-old transgenic mice. The fractionation procedure is diagrammed at the top. The different fractions are numbered 1 through 7, corresponding to the lane numbers. The PCR product representing the germ line configuration in Dβ-Jβ region is marked by an arrowhead.
FIG. 6
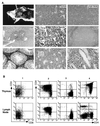
T-cell lymphoma in Id1 transgenic mice. (A) The appearance of a thymic lymphoma in a 3.5-month-old mouse and histological examination of the tumor and its metastatic sites. (B) FACS analysis of the thymus and lymph nodes of four 4-month-old transgenic mice numbered 1 to 4. The size of each thymus was similar to that shown in panel A. Lymph nodes were enlarged to various degrees. Cells were stained with antibodies against CD4 and CD8 as labeled.
Similar articles
- Hyperresponse to T-cell receptor signaling and apoptosis of Id1 transgenic thymocytes.
Qi Z, Sun XH. Qi Z, et al. Mol Cell Biol. 2004 Sep;24(17):7313-23. doi: 10.1128/MCB.24.17.7313-7323.2004. Mol Cell Biol. 2004. PMID: 15314144 Free PMC article. - Disordered T-cell development and T-cell malignancies in SCL LMO1 double-transgenic mice: parallels with E2A-deficient mice.
Chervinsky DS, Zhao XF, Lam DH, Ellsworth M, Gross KW, Aplan PD. Chervinsky DS, et al. Mol Cell Biol. 1999 Jul;19(7):5025-35. doi: 10.1128/MCB.19.7.5025. Mol Cell Biol. 1999. PMID: 10373552 Free PMC article. - A novel role for HEB downstream or parallel to the pre-TCR signaling pathway during alpha beta thymopoiesis.
Barndt R, Dai MF, Zhuang Y. Barndt R, et al. J Immunol. 1999 Sep 15;163(6):3331-43. J Immunol. 1999. PMID: 10477603 - Enhanced Notch activation is advantageous but not essential for T cell lymphomagenesis in Id1 transgenic mice.
Wang HC, Peng V, Zhao Y, Sun XH. Wang HC, et al. PLoS One. 2012;7(2):e32944. doi: 10.1371/journal.pone.0032944. Epub 2012 Feb 29. PLoS One. 2012. PMID: 22393458 Free PMC article. - Cross-talk between the T cell antigen receptor and the glucocorticoid receptor regulates thymocyte development.
Ashwell JD, King LB, Vacchio MS. Ashwell JD, et al. Stem Cells. 1996 Sep;14(5):490-500. doi: 10.1002/stem.140490. Stem Cells. 1996. PMID: 8888490 Review.
Cited by
- Inflammatory properties of inhibitor of DNA binding 1 secreted by synovial fibroblasts in rheumatoid arthritis.
Edhayan G, Ohara RA, Stinson WA, Amin MA, Isozaki T, Ha CM, Haines GK 3rd, Morgan R, Campbell PL, Arbab AS, Friday SC, Fox DA, Ruth JH. Edhayan G, et al. Arthritis Res Ther. 2016 Apr 12;18:87. doi: 10.1186/s13075-016-0984-3. Arthritis Res Ther. 2016. PMID: 27071670 Free PMC article. - E-Protein Inhibition in ILC2 Development Shapes the Function of Mature ILC2s during Allergic Airway Inflammation.
Barshad G, Webb LM, Ting HA, Oyesola OO, Onyekwere OG, Lewis JJ, Rice EJ, Matheson MK, Sun XH, von Moltke J, Danko CG, Tait Wojno ED. Barshad G, et al. J Immunol. 2022 Mar 1;208(5):1007-1020. doi: 10.4049/jimmunol.2100414. Epub 2022 Feb 18. J Immunol. 2022. PMID: 35181641 Free PMC article. - The divergence between T cell and innate lymphoid cell fates controlled by E and Id proteins.
Pankow A, Sun XH. Pankow A, et al. Front Immunol. 2022 Aug 10;13:960444. doi: 10.3389/fimmu.2022.960444. eCollection 2022. Front Immunol. 2022. PMID: 36032069 Free PMC article. Review. - Loss of thymocyte competition underlies the tumor suppressive functions of the E2a transcription factor in T-ALL.
Parriott G, Hegermiller E, Morman RE, Frank C, Saygin C, Stock W, Bartom ET, Kee BL. Parriott G, et al. Leukemia. 2024 Mar;38(3):491-501. doi: 10.1038/s41375-023-02123-4. Epub 2023 Dec 28. Leukemia. 2024. PMID: 38155245 - E Protein Transcription Factors as Suppressors of T Lymphocyte Acute Lymphoblastic Leukemia.
Parriott G, Kee BL. Parriott G, et al. Front Immunol. 2022 Apr 20;13:885144. doi: 10.3389/fimmu.2022.885144. eCollection 2022. Front Immunol. 2022. PMID: 35514954 Free PMC article. Review.
References
- Amsen D, Kruisbeek A M. Thymocyte selection: not by TCR alone. Immunol Rev. 1998;165:209–229. - PubMed
- Bain G, Robanus Maandag E C, Izon D J, Amsen D, Kruisbeek A M, Weintraub B, Krop I, Schlissel M S, Feeney A J, van Roon M, van der Valk M, te Riele H P J, Berns A, Murre C. E2A proteins are required for proper B cell development and initiation of immunoglobulin gene rearrangements. Cell. 1994;79:885–892. - PubMed
- Bain G, Robanus Maandag E C, te Riele H P, Feeney A J, Sheehy A, Schlissel M, Shinton S A, Hardy R R, Murre C. Both E12 and E47 allow commitment to the B cell lineage. Immunity. 1997;6:145–154. - PubMed
Publication types
MeSH terms
Substances
LinkOut - more resources
Full Text Sources
Other Literature Sources
Molecular Biology Databases
Research Materials
