Sequence of neuron origin and neocortical laminar fate: relation to cell cycle of origin in the developing murine cerebral wall - PubMed (original) (raw)
Sequence of neuron origin and neocortical laminar fate: relation to cell cycle of origin in the developing murine cerebral wall
T Takahashi et al. J Neurosci. 1999.
Abstract
Neurons destined for each region of the neocortex are known to arise approximately in an "inside-to-outside" sequence from a pseudostratified ventricular epithelium (PVE). This sequence is initiated rostrolaterally and propagates caudomedially. Moreover, independently of location in the PVE, the neuronogenetic sequence in mouse is divisible into 11 cell cycles that occur over a 6 d period. Here we use a novel "birth hour" method that identifies small cohorts of neurons born during a single 2 hr period, i.e., 10-20% of a single cell cycle, which corresponds to approximately 1.5% of the 6 d neuronogenetic period. This method shows that neurons arising with the same cycle of the 11 cycle sequence in mouse have common laminar fates even if they arise from widely separated positions on the PVE (neurons of fields 1 and 40) and therefore arise at different embryonic times. Even at this high level of temporal resolution, simultaneously arising cells occupy more than one cortical layer, and there is substantial overlap in the distributions of cells arising with successive cycles. We demonstrate additionally that the laminar representation of cells arising with a given cycle is little if at all modified over the early postnatal interval of histogenetic cell death. We infer from these findings that cell cycle is a neuronogenetic counting mechanism and that this counting mechanism is integral to subsequent processes that determine cortical laminar fate.
Figures
Fig. 1.
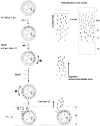
Neuronogenesis in the pseudostratified ventricular epithelium (PVE) in relation to the “inside-out pattern” of neocortical layer formation. A, The founder proliferative populations and their progeny in both dorsomedial (DCZ) and lateral (LCZ) cortical zones of the PVE execute 11 cell cycles (CC1_-CC11) over the course of the 6 d neuronogenetic interval, continuing from the eleventh (E11) embryonic day through E17 in the DCZ and E10 through E16 in the LCZ. The cycle sequence is initiated earlier and remains advanced by ∼24 hr in LCZ relative to DCZ (note for each cell cycle, a 24 hr difference in time of occurrence of corresponding cell cycles in DCZ and LCZ). The first neurons to arise from either region of the PVE are destined for the deepest cortical layers (dotted curved lines connecting the_PVE and layers VI and_V_), whereas progressively later forming neurons are destined for progressively more superficial layers (solid curved lines connecting the PVE and layers_IV_ and II/III). The daughter cells arising from cycle 11 are the terminal output (TO) of neuronogenesis. Curved arrows in the PVE show interkinetic nuclear migration through G1,S, G2, and M phases of the cell cycle. Interkinetic nuclear migration is shown for_CC2_ in the magnified view in the inset in_top left_. A fraction of postmitotic cells (Q) leaves the PVE with each cycle and migrates toward the surface of the hemisphere as young neurons.B, C, DCZ and_LCZ_ of the PVE of the embryonic cerebral hemisphere (B, coronal cutaway) give rise (curved arrows connecting B and C) to neurons destined, respectively, for fields 1 and 40 in the adult hemisphere (C, coronal cutaway).
Fig. 2.
Labeling schedule for the birth hour of a 2 hr cohort. Proliferative cells in the PVE within the ventricular zone (VZ) are asynchronously distributed through_G1_, S, G2, and_M_ phases of cell cycle (top, left panel, open eclipses lined up inside the_circle_; M phase nuclei are shown as open circles with two zigzag lines). The PVE was exposed initially at 7 A.M. to 3H-TdR (arrowhead with “silver grains_”), which was followed in 2 hr by BUdR (filled arrowhead). Cells that exit S-phase in the 2 hr interval between these exposures, and their postmitotic progeny, will be labeled with 3H-TdR but not BUdR (white nuclei with_grains). They are readily distinguished in autoradiograms (a curved arrow with an_asterisk_ = 2 hr cohort) from cells labeled in S phase by both 3H-TdR and BUdR (dark nuclei_with grains) or cells labeled only by BUdR (dark nuclei with no grains). BUdR injections were continued (open arrowheads) for a time longer than the combined duration of G2, M, and_G1 phases of the cell cycle (i.e., >T_C −_T_S) so that postmitotic cells reentering S phase (P or P fraction) will become marked with BUdR (bottom left, dark nuclei with_grains under the letter P). The postmitotic daughter cells that leave the cycle (Q_fraction of the original 2 hr cohort) may be recognized subsequently as cells labeled only by 3H-TdR (bottom left,white nuclei with grains, next to the_letter Q). At P22, long after their migrations across the intermediate zone to the CP and redistribution in the cortex, their locations with respect to layers I–VI within fields 1 and 40 are mapped from autoradiograms.
Fig. 3.
Distribution of the E13 cohort in field 1. A cohort of cells leaving S phase in synchrony over the 2 hr interval between 7 and 9 A.M. on E13 were marked by the sequential3H-TdR–BUdR exposure schedule described in Figure 2. The_Q_ fraction of the postmitotic daughter cells of this cohort (arrowheads, cells labeled only with3H-TdR) are distributed over the height of layer VI in field 1. Filled arrows, Cells labeled only with BUdR;curved arrows, cells labeled with both3H-TdR and BUdR; open arrows, nonlabeled cells. Dotted line marks the white matter/layer VI boundary. L, Lateral ventricle. Scale bar, 10 um.
Fig. 4.
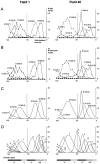
Distributions within fields 1 (left) and 40 (right) of neuronogenetic output with respect to both embryonic days and cell cycles. For each plot, the height of fields 40 and 1 have been normalized as a percentile (abscissa), and the projection of the cortical layer has been scaled appropriately to each field. The_shaded bars_ at the bottom indicate the borders of each of the cortical laminae. A vertical dotted line in each of the graphs marks the boundary between layers V and IV (also see Materials and Methods). A, The positions of cells of 2 hr cohorts, labeled on each of embryonic days. The average number of cells of each cohort observed in a standard coronal sector per section is given on the_ordinate_. The individual cohorts are identified with respect to both their embryonic day of origin (E11–E16) and their cell cycle of origin (in parentheses after embryonic date). Note that cells of an E11 cohort are detected in field 40 but not in field 1. In field 40 the E11 cohort arises near the completion of cycle 3 (at cycle 2.9). B, The plot of 2 hr cohort distribution represented in A is transformed to output of corresponding cell cycle by multiplying the number per cohort by_T_C/2 hr (T_c = cell cycle length in hours) for the respective cycle. Note that the form of each distribution in plots_A and B is the same but that the number of cells per distribution on the ordinate in B is larger than in A, and the relative heights are changed because of the lengthening of the cell cycle. For_A_–D, the distributions represent “net output,” that is, the populations remaining after cell death (Verney et al., 1999). C, For each of the distributions plotted in B, a “best fit” normal distribution was calculated. These normal distributions account for virtually all of the variance seen in B; see Results. D, The contribution of the output of each of the full 11-cycle series is reconstructed as normal distribution by interpolation from the curves shown in C. Note that a portion of the output of cycles 1–5 is not represented within the six layers of the cortex and is assumed to have contributed to the subplate and been eliminated by cell death. TO refers to the terminal output after cycle 11 (Takahashi et al., 1996a).
Fig. 5.
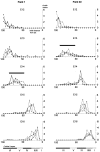
Animal to animal variation in neuron distribution by cohort. The distributions of the E12–E16 cohorts, normalized to percentile height, are plotted for separate animals in fields 1 (left) and 40 (right). The projection of the cortical layers, scaled appropriately to each field, is shown at the bottom. The distributions are essentially indistinguishable except for the cohorts distributed to midcortical layers that vary from animal to animal. These are the E13 cohort in field 40 and the E14 cohort in field 1 (bars above distributions). See Results for details.
Fig. 6.
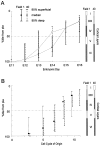
Intracortical distribution presented as median and range that contains 95% of the cells in each 2 hr cohort. Distributions within fields 1 and 40 are mapped for each embryonic day with respect to cortical height expressed as percentile (on the_ordinate_). The 95% range of distributions is some 22–56% of the cortical height. Note that an E11 cohort is present only in field 40. The distributions of E13 and E14 cohorts diverge sharply in fields 1 and 40 (A). By contrast, the distributions of cohorts with respect to cell cycle of origin (B) are closely similar in the two cortical fields. The bars on the right show the laminar borders for each cortical area.
Fig. 7.
Intracortical distributions of cohorts of cells arising on E13–E15 determined at P0. The cortical plate (CP, between two arrowheads) at P0 corresponds to layers II/III-IV at P22. Note that the distribution pattern of each cohort at P0 is essentially identical to that at P22 (Fig. 4_A_).
Fig. 8.
A schematic diagram of the contribution, patterns of distribution, and intermixing of neurons by cycle of origin. This plot is a summary of the individual distributions plotted in Figure4_D_ and shows the contribution and distribution pattern of net output from each cycle to each cortical layer. The output of each cycle is color-coded and_numbered_. TO refers to the terminal output after cycle 11 at the end of the neuronogenetic interval. Cell number per counting sector (ordinate; also see Materials and Methods) is a net number, that is, a number that is obtained at P22 after histogenetic cell death is completed. Net neuronal output is lowest to midcortex, corresponding to layer V, where the contribution arises principally with cycles 7 and 8 in both fields. It is evident that all layers, and particularly the deepest levels of layer VI, represent the contributions of many cycles.
Fig. 9.
A summary of the cell cycle of origin of neurons for each cortical layer. A, The proportion of the output of each cycle (cycle numbers at the _top_of each histogram), expressed as percentage (ordinate), is plotted with respect to layer of destination (abscissa) for fields 1 (left) and 40 (right). Virtually 100% of the output of cell cycles 1–6 is distributed exclusively in layer VI in both fields, but the output of cycles 7–11 goes to multiple layers. B, The proportion of its cells, expressed as percentage (ordinate), that each layer receives from each of the 11 cycles of neuronogenesis. Each of the cortical layers receives output from multiple cell cycles.
Similar articles
- Independent controls for neocortical neuron production and histogenetic cell death.
Verney C, Takahashi T, Bhide PG, Nowakowski RS, Caviness VS Jr. Verney C, et al. Dev Neurosci. 2000;22(1-2):125-38. doi: 10.1159/000017434. Dev Neurosci. 2000. PMID: 10657705 - Population dynamics during cell proliferation and neuronogenesis in the developing murine neocortex.
Nowakowski RS, Caviness VS Jr, Takahashi T, Hayes NL. Nowakowski RS, et al. Results Probl Cell Differ. 2002;39:1-25. doi: 10.1007/978-3-540-46006-0_1. Results Probl Cell Differ. 2002. PMID: 12353465 Review. - A gradient in the duration of the G1 phase in the murine neocortical proliferative epithelium.
Miyama S, Takahashi T, Nowakowski RS, Caviness VS Jr. Miyama S, et al. Cereb Cortex. 1997 Oct-Nov;7(7):678-89. doi: 10.1093/cercor/7.7.678. Cereb Cortex. 1997. PMID: 9373022 - Interkinetic and migratory behavior of a cohort of neocortical neurons arising in the early embryonic murine cerebral wall.
Takahashi T, Nowakowski RS, Caviness VS Jr. Takahashi T, et al. J Neurosci. 1996 Sep 15;16(18):5762-76. doi: 10.1523/JNEUROSCI.16-18-05762.1996. J Neurosci. 1996. PMID: 8795631 Free PMC article. - The G1 restriction point as critical regulator of neocortical neuronogenesis.
Caviness VS Jr, Takahashi T, Nowakowski RS. Caviness VS Jr, et al. Neurochem Res. 1999 Apr;24(4):497-506. doi: 10.1023/a:1022579712262. Neurochem Res. 1999. PMID: 10227682 Review.
Cited by
- Ex utero electroporation and whole hemisphere explants: a simple experimental method for studies of early cortical development.
Nichols AJ, O'Dell RS, Powrozek TA, Olson EC. Nichols AJ, et al. J Vis Exp. 2013 Apr 3;(74):50271. doi: 10.3791/50271. J Vis Exp. 2013. PMID: 23609059 Free PMC article. - Histogenetic processes leading to the laminated neocortex: migration is only a part of the story.
Caviness VS, Bhide PG, Nowakowski RS. Caviness VS, et al. Dev Neurosci. 2008;30(1-3):82-95. doi: 10.1159/000109854. Dev Neurosci. 2008. PMID: 18075257 Free PMC article. Review. - Basic fibroblast growth factor (Fgf2) is necessary for cell proliferation and neurogenesis in the developing cerebral cortex.
Raballo R, Rhee J, Lyn-Cook R, Leckman JF, Schwartz ML, Vaccarino FM. Raballo R, et al. J Neurosci. 2000 Jul 1;20(13):5012-23. doi: 10.1523/JNEUROSCI.20-13-05012.2000. J Neurosci. 2000. PMID: 10864959 Free PMC article. - Growth-Promoting Treatment Screening for Corticospinal Neurons in Mouse and Man.
Hanuscheck N, Schnatz A, Thalman C, Lerch S, Gärtner Y, Domingues M, Bitar L, Nitsch R, Zipp F, Vogelaar CF. Hanuscheck N, et al. Cell Mol Neurobiol. 2020 Nov;40(8):1327-1338. doi: 10.1007/s10571-020-00820-7. Epub 2020 Mar 14. Cell Mol Neurobiol. 2020. PMID: 32172457 Free PMC article. - An adhesion signaling axis involving Dystroglycan, β1-Integrin, and Cas adaptor proteins regulates the establishment of the cortical glial scaffold.
Wong W, Estep JA, Treptow AM, Rajabli N, Jahncke JN, Ubina T, Wright KM, Riccomagno MM. Wong W, et al. PLoS Biol. 2023 Aug 4;21(8):e3002212. doi: 10.1371/journal.pbio.3002212. eCollection 2023 Aug. PLoS Biol. 2023. PMID: 37540708 Free PMC article.
References
- Alexiades M, Cepko C. Subsets of retinal progenitors display temporally regulated and distinct biases in the fates of their progeny. Development. 1997;124:1119–1131. - PubMed
- Anderson S, Eisenstat D, Shi L, Rubenstein J. Interneuron migration from basal forebrain to neocortex: dependence on Dlx genes. Science. 1997;278:474–476. - PubMed
- Angevine J. Time of neuron origin in the hippocampal region: an autoradiographic study in the mouse. Exp Neurol [Suppl] 1965;2:1–71. - PubMed
- Angevine JB, Sidman RL. Autoradiographic study of cell migration during histogenesis of the cerebral cortex in the mouse. Nature. 1961;192:766–768. - PubMed
- Bayer SA, Altman J. Neocortical development. Raven; New York: 1991.
Publication types
MeSH terms
LinkOut - more resources
Full Text Sources


