Two components of actin-based retrograde flow in sea urchin coelomocytes - PubMed (original) (raw)
Two components of actin-based retrograde flow in sea urchin coelomocytes
J H Henson et al. Mol Biol Cell. 1999 Dec.
Free PMC article
Abstract
Sea urchin coelomocytes represent an excellent experimental model system for studying retrograde flow. Their extreme flatness allows for excellent microscopic visualization. Their discoid shape provides a radially symmetric geometry, which simplifies analysis of the flow pattern. Finally, the nonmotile nature of the cells allows for the retrograde flow to be analyzed in the absence of cell translocation. In this study we have begun an analysis of the retrograde flow mechanism by characterizing its kinetic and structural properties. The supramolecular organization of actin and myosin II was investigated using light and electron microscopic methods. Light microscopic immunolocalization was performed with anti-actin and anti-sea urchin egg myosin II antibodies, whereas transmission electron microscopy was performed on platinum replicas of critical point-dried and rotary-shadowed cytoskeletons. Coelomocytes contain a dense cortical actin network, which feeds into an extensive array of radial bundles in the interior. These actin bundles terminate in a perinuclear region, which contains a ring of myosin II bipolar minifilaments. Retrograde flow was arrested either by interfering with actin polymerization or by inhibiting myosin II function, but the pathway by which the flow was blocked was different for the two kinds of inhibitory treatments. Inhibition of actin polymerization with cytochalasin D caused the actin cytoskeleton to separate from the cell margin and undergo a finite retrograde retraction. In contrast, inhibition of myosin II function either with the wide-spectrum protein kinase inhibitor staurosporine or the myosin light chain kinase-specific inhibitor KT5926 stopped flow in the cell center, whereas normal retrograde flow continued at the cell periphery. These differential results suggest that the mechanism of retrograde flow has two, spatially segregated components. We propose a "push-pull" mechanism in which actin polymerization drives flow at the cell periphery, whereas myosin II provides the tension on the actin cytoskeleton necessary for flow in the cell interior.
Figures
Figure 1
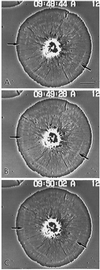
Video-enhanced phase contrast microscopy of living subtype 1 cell showing the radial nature of the actin cytoskeleton in a cell undergoing retrograde flow. The inward flow of the membrane and the underlying actin cytoskeleton can be tracked by following the movement of white arcs in the cytoplasm (arrows). These arcs represent discontinuities in the actin cytoskeleton (see Figure 3C). Bar, 10 μm.
Figure 2
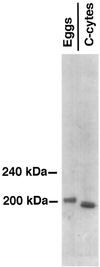
Immunoblot of anti-sea urchin egg myosin II heavy chain against high-speed supernatant samples from sea urchin eggs and coelomocytes (C-cytes) run on 4% gels. The antiserum monospecifically labels a band of ∼200 kDa in the egg sample lane and a band of slightly lower molecular mass in the coelomocyte lane.
Figure 3
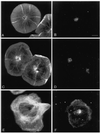
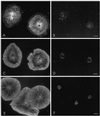
Immunolocalization of actin (A and C) and myosin II (B and D) in subtype 1 cells shows actin filaments arrayed in a dense cortical network, which feeds into inner radial bundles, as well as the perinuclear distribution and ring-like nature of the myosin staining pattern. Note that the dark arcs in the actin staining pattern (C) correspond to the white arcs present in video-enhanced images of living cells (Figure 1) and represent areas of low actin filament concentration. Immunolocalization of actin (E) and myosin II (F) in a subtype 2 cell shows that, in contrast to the perinuclear myosin ring present in subtype 1 cells, myosin in subtype 2 cells is widely distributed in the cytoplasm and often aligns itself with transverse stress fiber-like actin bundles. Bar, 10 μm.
Figure 4
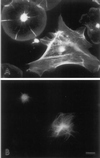
Immunofluorescent labeling of actin (A) and tubulin (B) in coelomocyte subtypes shows a limited, perinuclear microtubule array in subtype 1 cells (upper left cell), whereas subtype 2 cells (lower right cell) display a widespread microtubule array. Bar, 10 μm.
Figure 5
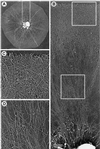
TEM of a critical point-dried and rotary-shadowed cytoskeleton from a subtype 1 coelomocyte. (A) Low-magnification view of a coelomocyte cytoskeleton. The box in A outlines the region that appears magnified in B, whereas the boxes in B outline the regions shown at higher magnification in C (upper box) and D (lower box). The outer cortical region of the cell consists of a dense meshwork of diagonally oriented actin filaments (B and C) containing a subset of elongated filaments oriented tangential to the edge of the cell (C). Inward from the cortical meshwork the actin organization changes to one containing radial bundles and loose actin arrays (B and D). Note the apparent continuity within the actin cytoskeleton throughout the cell and the fact that individual actin filaments can be traced for long distances. The complex perinuclear region containing actin filament terminations, microtubules, and the remnants of organelles appears at the bottom of B. Bar, 1 μm.
Figure 6
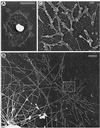
TEM of critical point-dried and rotary-shadowed cytoskeletons from gelsolin-extracted subtype 1 coelomocytes. (A) Low-magnification view of an extracted cytoskeleton revealing the presence of distinct short myosin bipolar filaments arrayed in a ring around the nucleus of the cell. Note that the myosin filaments form pyramidal-shaped aggregates, which extend away from the nucleus. (B) Higher-magnification view of a perinuclear ring of myosin filaments, with the box outlining a region at even higher magnification in C. These images indicate that the filamens are clearly myosin-like in their appearance (dumbbell shape with naked rod and globular heads) and organization (head-to-head and side-to-side associations as well as networks). Note that microtubules (large, curved filaments) are largely restricted to the region inside of the myosin ring in these cells. Bars: A, 10 μm; B, 1 μm; C, 0.1 μm.
Figure 7
(A–C) Video-enhanced microscopy of subtype 1 coelomocyte treated with 1 μM cytochalasin D. The treatment (started at 11:30:30) stops peripheral flow and causes the development of a cortical actin-free fringe as the central cytoskeleton exhibits a finite retraction away from the cell edge. After several minutes in cytochalasin (C), the central actin cytoskeleton becomes disrupted. (D and E) Actin (D) and myosin II (E) immunolabeling of coelomocytes exposed to cytochalasin for 10 min. Note that the cortical fringe is devoid of actin and that the central cytoskeleton is greatly disrupted. Bar, 10 μm.
Figure 8
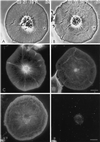
Video-enhanced microscopy of a control subtype 1 coelomocyte (A) and the same cell after exposure to 2 μM staurosporine for 15 min (B). The treatment results in the stoppage of flow in the cell center and the continuance of flow in the cell periphery. This results in the buildup of a notable medial ridge of cytoskeletal and membrane material in between the cortex and the cell center. Rhodamine-phalloidin staining of control (C) and staurosporine treated (D) cells shows that the structural organization of actin in the cell cortex is quite similar; however, there is clearly a disruption of the central actin radial array under the influence of the kinase inhibitor. In addition, the accumulation of actin is seen in the inhibitor-induced medial ridge. Actin (E) and myosin (F) labeling of a cell treated with 500 nM KT5926 shows an actin arrangement similar to that seen with staurosporine (D) and also demonstrates that the perinuclear myosin ring has become disorganized coincident with the rearrangement of the central actin cytoskeleton and the arrest of interior flow. Bar, 10 μm.
Figure 9
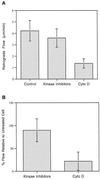
(A) Retrograde flow rate of control cells and cells treated with kinase inhibitors, as well as retrograde retraction of the central cytoskeleton in cells treated with cytochalasin D. Note that the flow rate in control cells is not statistically significantly different from the rate exhibited at the periphery of kinase inhibitor-treated cells; however, it is significantly greater than the cytochalasin D retraction rate (p = 0.01). (B) Percent flow in cells treated with kinase inhibitors or cytochalasin D relative to the flow rate in the same cell before treatment.
Figure 10
Video-enhanced microscopy of a control subtype 1 coelomocyte (A) and the same cell treated for 5 min with 15 mM BDM (B). The BDM causes the arrest of peripheral flow and development of a cortical fringe through the finite retraction of the central cytoskeleton. The fringe contains tangentially oriented ridges, which become particularly apparent over time (C, cell treated with BDM for 20 min). Rhodamine-phalloidin labeling of actin filaments in a BDM-treated cell (D) demonstrates the tangential actin filaments in the cortical fringe as well as the disrupted nature of the internal actin cytoskeleton. Bar, 10 μm.
Figure 11
Immunolocalization of actin (A, C, and E) and myosin (B, D, and F) in coelomocytes fixed in the presence of 15 mM BDM (A and B) or after washing out the drug for either 5 min (C and D) or 20 min (E and F). Note that the acto-myosin organizational structure in the cells, which is disrupted by BDM treatment (A and B), gradually reappears during the washout with the reestablishment of retrograde flow (C and D) and by 20 min is essentially identical to that seen in untreated controls (compare E and F with Figure 3, A and B). Bar, 10 μm.
Similar articles
- Wound closure in the lamellipodia of single cells: mediation by actin polymerization in the absence of an actomyosin purse string.
Henson JH, Nazarian R, Schulberg KL, Trabosh VA, Kolnik SE, Burns AR, McPartland KJ. Henson JH, et al. Mol Biol Cell. 2002 Mar;13(3):1001-14. doi: 10.1091/mbc.01-04-0167. Mol Biol Cell. 2002. PMID: 11907278 Free PMC article. - Endothelial cell retraction is induced by PAK2 monophosphorylation of myosin II.
Zeng Q, Lagunoff D, Masaracchia R, Goeckeler Z, Côté G, Wysolmerski R. Zeng Q, et al. J Cell Sci. 2000 Feb;113 ( Pt 3):471-82. doi: 10.1242/jcs.113.3.471. J Cell Sci. 2000. PMID: 10639334 - Decreased phosphorylation of four 20-kDa proteins precedes staurosporine-induced disruption of the actin/myosin cytoskeleton in rat astrocytes.
Mobley PL, Hedberg K, Bonin L, Chen B, Griffith OH. Mobley PL, et al. Exp Cell Res. 1994 Sep;214(1):55-66. doi: 10.1006/excr.1994.1233. Exp Cell Res. 1994. PMID: 8082748 - Myosins, Actin and Autophagy.
Kruppa AJ, Kendrick-Jones J, Buss F. Kruppa AJ, et al. Traffic. 2016 Aug;17(8):878-90. doi: 10.1111/tra.12410. Epub 2016 May 31. Traffic. 2016. PMID: 27146966 Free PMC article. Review. - Force propagation across cells: mechanical coherence of dynamic cytoskeletons.
Cai Y, Sheetz MP. Cai Y, et al. Curr Opin Cell Biol. 2009 Feb;21(1):47-50. doi: 10.1016/j.ceb.2009.01.020. Epub 2009 Feb 7. Curr Opin Cell Biol. 2009. PMID: 19208463 Free PMC article. Review.
Cited by
- Arp2/3 complex inhibition radically alters lamellipodial actin architecture, suspended cell shape, and the cell spreading process.
Henson JH, Yeterian M, Weeks RM, Medrano AE, Brown BL, Geist HL, Pais MD, Oldenbourg R, Shuster CB. Henson JH, et al. Mol Biol Cell. 2015 Mar 1;26(5):887-900. doi: 10.1091/mbc.E14-07-1244. Epub 2015 Jan 7. Mol Biol Cell. 2015. PMID: 25568343 Free PMC article. - Lamellipodial actin mechanically links myosin activity with adhesion-site formation.
Giannone G, Dubin-Thaler BJ, Rossier O, Cai Y, Chaga O, Jiang G, Beaver W, Döbereiner HG, Freund Y, Borisy G, Sheetz MP. Giannone G, et al. Cell. 2007 Feb 9;128(3):561-75. doi: 10.1016/j.cell.2006.12.039. Cell. 2007. PMID: 17289574 Free PMC article. - Nonmuscle myosin IIA-dependent force inhibits cell spreading and drives F-actin flow.
Cai Y, Biais N, Giannone G, Tanase M, Jiang G, Hofman JM, Wiggins CH, Silberzan P, Buguin A, Ladoux B, Sheetz MP. Cai Y, et al. Biophys J. 2006 Nov 15;91(10):3907-20. doi: 10.1529/biophysj.106.084806. Epub 2006 Aug 18. Biophys J. 2006. PMID: 16920834 Free PMC article. - Cell biology of embryonic migration.
Kurosaka S, Kashina A. Kurosaka S, et al. Birth Defects Res C Embryo Today. 2008 Jun;84(2):102-22. doi: 10.1002/bdrc.20125. Birth Defects Res C Embryo Today. 2008. PMID: 18546335 Free PMC article. Review. - Phospholipid phosphatase related 1 (PLPPR1) increases cell adhesion through modulation of Rac1 activity.
Tilve S, Iweka CA, Bao J, Hawken N, Mencio CP, Geller HM. Tilve S, et al. Exp Cell Res. 2020 Apr 15;389(2):111911. doi: 10.1016/j.yexcr.2020.111911. Epub 2020 Feb 14. Exp Cell Res. 2020. PMID: 32061832 Free PMC article.
References
- Bray D, White JG. Cortical flow in animal cells. Science. 1988;239:883–888. - PubMed
- Bryan J, Kane RE. Actin gelation in sea urchin egg extracts. Methods Cell Biol. 1982;25:175–199. - PubMed
- Cheney RE, Riley MA, Mooseker MS. Phylogenetic analysis of the myosin superfamily. Cell Motil Cytoskeleton. 1993;24:215–223. - PubMed
Publication types
MeSH terms
Substances
LinkOut - more resources
Full Text Sources
Miscellaneous
