Reduced facilitation and vesicular uptake in crustacean and mammalian neuromuscular junction by T-588, a neuroprotective compound - PubMed (original) (raw)
Reduced facilitation and vesicular uptake in crustacean and mammalian neuromuscular junction by T-588, a neuroprotective compound
K Hirata et al. Proc Natl Acad Sci U S A. 1999.
Abstract
Bath application of compound T-588, a neuroprotective agent, reduced paired-pulse and repetitive-pulse facilitation at mammalian and crustacean neuromuscular junctions. In addition, it reduced voltage-gated sodium and potassium currents in a use-dependent fashion, but had only a small effect on the presynaptic Ca(2+) conductance. By contrast, it blocked FM 1-43 vesicular uptake but not its release, in both species. Postsynaptically, T-588 reduced acetylcholine currents at the mammalian junction in a voltage-independent manner, but had no effect on the crayfish glutamate junction. All of these effects were rapidly reversible and were observed at concentrations close to the compound's acute protective level. We propose that this set of mechanisms, which reduces high-frequency synaptic transmission, is an important contributory factor in the neuroprotective action of T-588.
Figures
Figure 1
Chemical structure of T-588
Figure 2
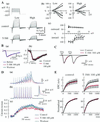
T-588 in crayfish neuromuscular junction. (A) Axonic voltage-gated currents. (a) Data acquired at low (<1 Hz) and high (40 Hz) voltage step frequency. (b) I–V relationship of control (○) and T-588 (●) (100 μM). (c) Current reduction by T-588. Inward (circles) and outward current (squares) are shown separately. Data represent the mean ± SE, n = 7 experiments. T-588 significantly reduced the inward current at high frequency (closed symbols) and less at low frequency (open symbols) indicating an inward current use-dependent block. *, P < 0.05; **, P < 0.01 probability by paired t test. (B) Single EPC. (a) Single EPC waveforms (recorded before, during T-588, and after washout) are superimposed. (b) Single EPC amplitudes measured every 0.5 msec and normalized (1.0 as peak amplitude in each experiment). Each point in the graph shows mean value of 15 preparations with SE. Black and red lines represent before and during 100 μM T-588, respectively. No change was observed. (C) Postsynaptic glutamate current. Glutamate current generated by paired pulses (at 400-msec intervals) iontophoresis of
l
-glutamate to a muscle fiber voltage-clamped at the neuromuscular junction. Average wave forms of 10 successive traces during T-588 (300 μM) and after washout are superimposed. (D) Synaptic facilitation and Ca2+ influx. Example waveform of EPPs (a) and presynaptic spikes (b) evoked by 10 repetitive stimulation at 40 Hz and the simultaneously recorded time course of Ca2+ influx (c) at a particular terminal are shown. Calcium uptake was determined from Fura-2 images acquired with two-photon microscopy as an averaged waveform of successive eight measurements. (E) EPC facilitation evoked by 40-Hz repetitive stimulation. (Upper) Absolute amplitude of EPC through 50th stimulus. (Lower) Amplitude is shown as percent to the maximum response in each group. Black and red before and during T-588, respectively. Each point is shown as a mean value with SE, n = 9 experiments.
Figure 3
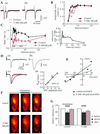
T-588 in mice neuromuscular junction. (A) Presynaptic spike amplitude reduction induced by paired-pulse stimulation at different intervals (a) 5 msec, (b) 20 msec in the presence of 100 μM T-588. Presynaptic perineurial currents are shown as averaged waveforms from 16 successive traces. (B) Presynaptic current amplitude ratio induced by paired-pulse stimulation with various intervals in control and 100 μM T-588. Data are shown as mean with SE from five experiments. Control data were taken after washing out of T-588. *, P < 0.05; **, P < 0.01 paired t test. (C) Synaptic facilitation induced by paired-pulse with various intervals in control and 100 μM T-588. (Left) The ratio of second EPP/first EPP are shown as facilitation indexes at each interval. The subtracted values (T-588 to control) are shown (Right). *, P < 0.05; **, P < 0.01 Student’s t test or Aspin-Welch test subsequent to F-test. (D) Nerve evoked EPCs (average of 32) 50 μM T-588 (a) and washout (45 min) (b). Waves were superimposed after normalization (c). The red lines show first-order exponential curves fitted to the off time course in each current (membrane held at −40 mV) (d). The relationship between decay time constant (off) and maximum value of averaged currents recorded during the washout of T-588. Data obtained at 5, 10, 15, 20, 30, and 45 min washout. (a and b) 0 and 45 minutes of washout, respectively. Experiments were done in 0.8 mM Ca2+/1.5 mM Mg2+ and μ-conotoxin GIIIB (2 μg/ml) to avoid contraction. (E) Current-voltage relationship of the mEPCs recorded at the same motor nerve terminal before (●) and 30-min superfusion of 100 μM T-588 (○). Data are fitted to a linear function. The slope value (m) is shown. (F) Ca2+ uptake during tetanic stimulation. Fura-2 AM loaded from extracellular melieu. Images were captured from brightest plain of the terminal before, during, and after terminate of tetanic stimulation (20 Hz). Fluorescence intensity of Fura-2 decreased with Ca2+ concentration increase. Scale bar represents 2 μm. (G) Fluorescence intensity of unit area measured from captured image with National Institutes of Health
image
. Data are shown as mean value with SE from five experiments. No significant difference was observed between control and T-588 on relative intensity during stimulation (paired t test).
Figure 4
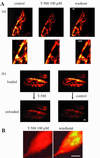
Two-photon microscopy imaging of FM 1–43 to determine synaptic vesicle endocytosis in crayfish and mice. (A) (a) The fluorescence image of mice motor nerve terminal-loaded FM 1–43 with tetanic stimulation in the presence of 100 μM T-588. Dye loading was repeated after washing out of T-588. Images were captured every 1-μm step in the Z direction and accumulated. The brightest images in the terminal are shown expanded in the lower column. (b) After full loading of FM 1–43, the preparation was treated with 100 μM T-588 for 30 min and then destained by tetanic stimulation (20 Hz, 10 min) without dye in the bath in the presence of T-588. The same set of experiments was repeated without T-588. (B) Fluorescence image of crayfish motor nerve terminal-loaded FM 1–43 with tetanic stimulation. Dye loading was repeated with 100 μM T-588 and washing out of T-588 after taking under control condition. Scale bar in each image represents 2 μm.
Figure 5
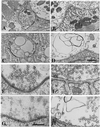
Electron micrographs of excitatory nerve terminals in crayfish and mice neuromuscular junctions. (A and B) Control terminals show typical numbers of synaptic vesicles in the active zones. In crayfish active zones are restricted to specific areas in the crayfish terminal and are widespread along the endplate area in the mice terminal. (C and D) Terminals exposed to T-588 show synaptic vesicles in very low numbers as compared with the controls. (E and F) As in G and H, compare details of the same terminals at higher magnification. [Scale bars: in D = 1.0 μm for A_–_D; in G = 0.5 μm for E_–_H.]
Similar articles
- Presynaptic facilitation at the crayfish neuromuscular junction. Role of calcium-activated potassium conductance.
Sivaramakrishnan S, Brodwick MS, Bittner GD. Sivaramakrishnan S, et al. J Gen Physiol. 1991 Dec;98(6):1181-96. doi: 10.1085/jgp.98.6.1181. J Gen Physiol. 1991. PMID: 1783897 Free PMC article. - Effects of increasing Ca2+ channel-vesicle separation on facilitation at the crayfish inhibitory neuromuscular junction.
Allana TN, Lin JW. Allana TN, et al. Neuroscience. 2008 Jul 17;154(4):1242-54. doi: 10.1016/j.neuroscience.2008.02.045. Epub 2008 Mar 7. Neuroscience. 2008. PMID: 18541384 Free PMC article. - Presynaptic calcium-activated potassium channels and calcium channels at a crayfish neuromuscular junction.
Blundon JA, Wright SN, Brodwick MS, Bittner GD. Blundon JA, et al. J Neurophysiol. 1995 Jan;73(1):178-89. doi: 10.1152/jn.1995.73.1.178. J Neurophysiol. 1995. PMID: 7714563 - Micropharmacology of vertebrate neuromuscular transmission.
Hubbard JI, Quastel DM. Hubbard JI, et al. Annu Rev Pharmacol. 1973;13:199-216. doi: 10.1146/annurev.pa.13.040173.001215. Annu Rev Pharmacol. 1973. PMID: 4351672 Review. No abstract available.
Cited by
- T-588 enhances neurite outgrowth and choline acetyltransferase in cultured rat spinal ventral horn neurons.
Iwasaki Y, Ikeda K, Ichikawa Y, Igarashi O, Kinoshita M, Marubuchi S, Ono S. Iwasaki Y, et al. Neurochem Res. 2002 Mar;27(3):225-8. doi: 10.1023/a:1014884504879. Neurochem Res. 2002. PMID: 11958520 - Purkinje cell long-term depression is prevented by T-588, a neuroprotective compound that reduces cytosolic calcium release from intracellular stores.
Kimura T, Sugimori M, Llinás RR. Kimura T, et al. Proc Natl Acad Sci U S A. 2005 Nov 22;102(47):17160-5. doi: 10.1073/pnas.0508190102. Epub 2005 Nov 8. Proc Natl Acad Sci U S A. 2005. PMID: 16278299 Free PMC article. - Post-synaptic specialization of the neuromuscular junction: junctional folds formation, function, and disorders.
Zou S, Pan BX. Zou S, et al. Cell Biosci. 2022 Jun 19;12(1):93. doi: 10.1186/s13578-022-00829-z. Cell Biosci. 2022. PMID: 35718785 Free PMC article. Review. - Normal motor learning during pharmacological prevention of Purkinje cell long-term depression.
Welsh JP, Yamaguchi H, Zeng XH, Kojo M, Nakada Y, Takagi A, Sugimori M, Llinás RR. Welsh JP, et al. Proc Natl Acad Sci U S A. 2005 Nov 22;102(47):17166-71. doi: 10.1073/pnas.0508191102. Epub 2005 Nov 8. Proc Natl Acad Sci U S A. 2005. PMID: 16278298 Free PMC article. - Transmitter release site organization can predict synaptic function at the neuromuscular junction.
Laghaei R, Ma J, Tarr TB, Homan AE, Kelly L, Tilvawala MS, Vuocolo BS, Rajasekaran HP, Meriney SD, Dittrich M. Laghaei R, et al. J Neurophysiol. 2018 Apr 1;119(4):1340-1355. doi: 10.1152/jn.00168.2017. Epub 2017 Dec 27. J Neurophysiol. 2018. PMID: 29357458 Free PMC article.
References
- Bittner G D. J Neurobiol. 1989;20:368–408. - PubMed
- Zucker R S. Annu Rev Neurosci. 1989;12:13–31. - PubMed
- Ono S, Kitamura K, Maekawa M, Hirata K, Ano M, Ukai W, Yamafuji T, Narita H. Jpn J Pharmacol. 1993;62:81–86. - PubMed
Publication types
MeSH terms
Substances
LinkOut - more resources
Full Text Sources
Miscellaneous


